According to UN and numerous other research agencies about 80% of world’s energy demand is satisfied by converting fossil fuels in to usable energy. It involves the process of planning, exploration, exploitation and management of natural resources. These processes inherently have their own set of risks and benefits. By identifying and managing the issues will boost our energy and resource hungry civilization to the next level.
Click on the image for larger high resolution file.
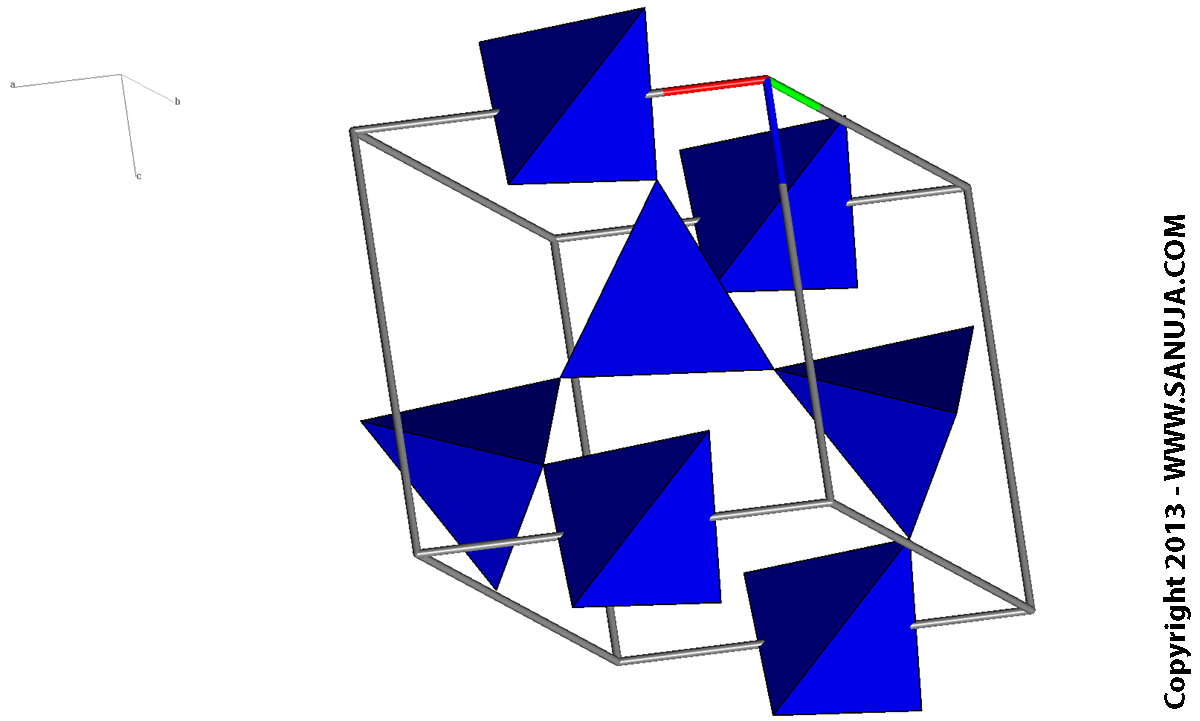
Dark blue is Silicate Tetrahedra, green is bonds and the light blue is sodium.
Olivine – Isolated Tetrahedra
The isolated tetrahedra is a group of silicates in which the crystal structures have no shared oxygen between them. Therefore minerals like Olivine and Garnet are held together by the attaraction force between silica tetrahedra and the surrounding cat ions. This is the least polymerized type.
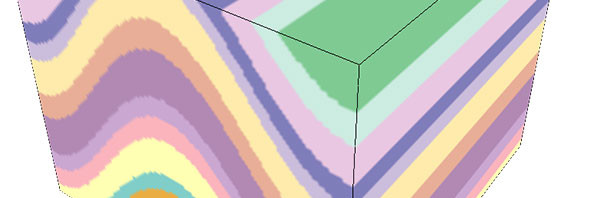
The structure contours are very important for understanding geologic features. They are used to demonstrate three denominational models using one denominational paper. More often the structure contouring techniques are often used to widen our understanding of sub-surface geology, but it is also equally useful in mapping non-penetrative geological features.
General Procedure
Look for intersections between the geologic feature(s) of interest and elevation contours on the map.
Plot as many points of intersect as possible. Higher the number of points, better accuracy for the structure contours.
Determine the appropriate contour interval.
Interpolate the plotted locations by connecting them using a logical process. The quantity of intersection points will directly impact the accuracy of the lines.
I usually start my structure contour lines from a location that either has a lot of intersection points or a location with the most highest geologic complexity. Be careful not to make an error in tight areas because often mistakes can go unnoticed in complex regions.
Rules of Contours
Geologists are famous for making assumptions on the fly. The assumptions we make always have some underlying set of rules. Otherwise Geology would not be a science, but an art. Let’s look at the rules we follow…(1)
Every contour must pass between points of higher and lower elevation. In other terms, a contour line should only pass through points of intersection in equal elevation.
Contour lines should not merge or cross except where the surface is vertical or is repeated due to overturned folding or reverse faulting. The lower set of repeated contours should be dashed.
Contour lines should either close within the map area or be truncated by the edge of the map or by a fault. Closed depressions are indicated by hash marks (tic marks)on the low side of the inner bounding contour.
Contour lines are repeated to indicate reversals in the slope direction. Rarely will a contour ever fall exactly on the crest or trough of a structure.
Faults cause breaks in a continuous map surface. Normal separation faults cause gaps in the contoured horizon, reverse separation faults cause overlapping contoursand vertical faults cause linear discontinuities in elevation. Where beds are repeated by reverse faulting, it will usually be clearer to prepare separate maps for the hangingwall and footwall.
The map should honor the trend or trends present in the area. Crestal traces, trough traces, fold hinges and inflection lines usually form straight lines or smooth curvesas appropriate for the structural style.
Errors in Contours
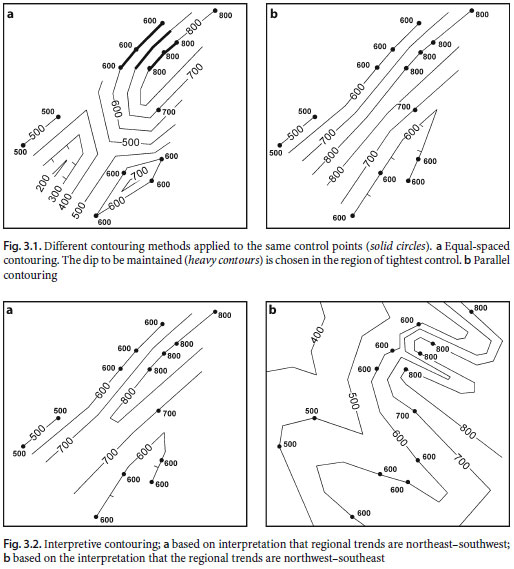
There is a great deal of interpretation and judgement involved in when deciding on where the lines should go on the map. Even with advanced algorithms used for sanitation of data in geological software, there is always a possibility for errors. The ambiguity of data could lead to different structural styles in contouring. Same data, but different contour. Which one is right? Unless we have additional data to either verify or refute our interpretations, you could categorically argue all contour lines drawn based on just the map data can be valid. The above diagram of four different versions of interpretations on the same map is a good example why we need a lot more data than just a map with some intersections to draw accurate contours.
References
1. 3D Structural Geology; A Piratical Guide to Quantitative Surface and Subsurface Map Interpretation SE; Groshong, Jr., 2006
The select all, none and invert functions uses JavaScript code. If your browser (like old mobile phones) cannot handle JS, you will sill be able to read the list, but may not be able to tick off the check boxes on the left most side. A word to those poor Geologists who still on IE instead of FireFox, Chrome (or webkit) or Opera, the time has come for a change. As always, the Print button at the top will remove my title images, menus and border for you to print. The check marks will also print as it is so you can use this page just like an Excel file.
This list may not be complete. Always check with your educational institution before making any arrangements. I am not responsible for you getting attack by a small rat in the woods or a bunch of engineers up to no good.
Travel Essentials
Personal and Safety Gear
Tools and Equipment
Electronics
If you would like to edit or add items to this list, please contact me. Improving this list may help your fellow students.
There are thousands of research reports written on 2D and 3D thinking skills on the internet. You can read them all, but I do not believe absorbing those highly academic reports would make any difference for improving your ability in spatial visualization. The main message in all those reports is; the ability to understand 3D structures are very important to Science and Engineering students.
I use cookies to optimize site functionality and improve your experience. By continuing to use this site, you accept the use of cookies stated under Privacy Policy and Terms of Use. Read MoreACCEPT
Cookies
Privacy Overview
This website uses cookies to improve your experience while you navigate through the website. Out of these cookies, the cookies that are categorized as necessary are stored on your browser as they are essential for the working of basic functionalities of the website. We also use third-party cookies that help us analyze and understand how you use this website. These cookies will be stored in your browser only with your consent. You also have the option to opt-out of these cookies. But opting out of some of these cookies may have an effect on your browsing experience.
Necessary cookies are absolutely essential for the website to function properly. This category only includes cookies that ensures basic functionalities and security features of the website. These cookies do not store any personal information.