Introduction to Petroleum Geology
Disclaimer: While every reasonable effort is made to ensure that the information provided is accurate, no guarantees for the currency or accuracy of information are made. It takes several proof readings and rewrites to bring the quiz to an exceptional level. If you find an error, please contact me as soon as possible. Please indicate the question ID-Number or description because server may randomize the questions and answers.
Geology (GLGY 577-UCAL) Midterm Exam
Congratulations - you have completed Geology (GLGY 577-UCAL) Midterm Exam.
You scored %%SCORE%% out of %%TOTAL%%. With incorrect multiple tries your score is %%PERCENTAGE%%
Your performance has been rated as %%RATING%%
Question 1 |
A | Gasoline |
B | Residuum |
C | Diesel fuel |
D | Lubricating oil |
E | Heavy gas oil |
F | Kerosene |
Question 2 |
A | Calibrate the Ro line with the core or well logs. |
B | Use the Ro line that is most centered to the all other Ro lines. |
C | Generate several parallel Ro lines on the Pickett Plot. |
D | Generate several Ro lines on the Pickett Plot. |
E | Generate the most two extreme Ro lines on the Pickett Plot with the maximum Rt and minimum Rt as your reference bounds. |
Question 3 |
A | Rw |
B | Rmc |
C | Ro |
D | Rt |
E | Rm |
Question 4 |
A | ~ 1.76 |
B | ~ 0.20 |
C | ~ 2.81 |
D | ~ 3.50 |
E | ~ 0.71 |
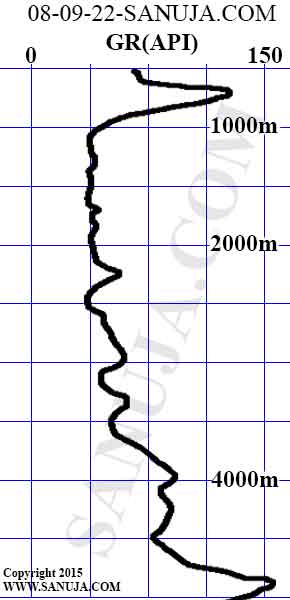
Net shale interval = 5000 m - 3550 m = 1450 m (read off the GR curve)
Hence, sand:shale = 2550 m/1450 m = 1.7586...
Question 5 |
A | It measures the slow-down length of neutrons when they interacts with atoms. |
B | A typical tool uses uranium as the energy source. |
C | It measures the true density of the material. |
D | Typically, silicon has a higher neutron reading than carbon. |
E | The thermal phase of the tool uses energy at around 10 eV |
Question 6 |
A | The calculated net sand volume may be incorrect. |
B | The key well logs features may not be able to correlate further away from the reference wells. |
C | The topography of the area may be distorted. |
D | The overall assessment of the geology may be completely wrong. |
E | The obvious features of the well logs may be ignored. |
Question 7 |
A | 2D seismic data acquisition |
B | 3D seismic data acquisition |
C | 4D seismic data acquisition |
D | Crosswell seismic data acquisition |
Question 8 |
BHT (bottom hole temperature) = 255o F
Surface temperature = 75o F
Depth which BHT was measured: 11400 ft
A | ~ 0.028oF/ft |
B | ~ 0.029oF/ft |
C | ~ 0.018oF/ft |
D | ~ 0.015oF/ft |
E | ~ 0.016oF/ft |
Question 9 |
A | Very high gamma ray kick Hint: You need the scale for this interpretation. |
B | Coarsening upward sequence |
C | Coarsening downward sequence |
D | Net sand content Hint: You need the scale for this calculation. |
Question 10 |
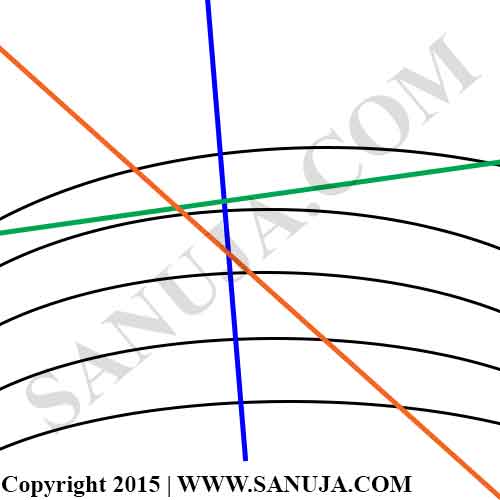
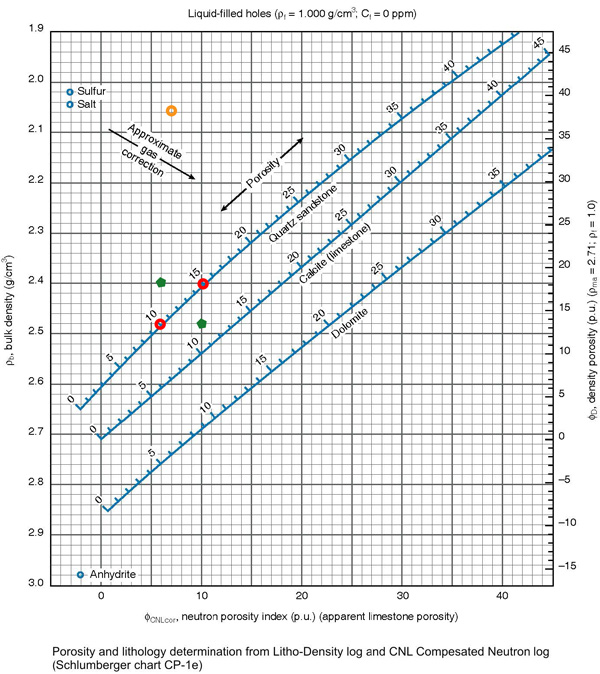
A | blue , orange , green |
B | orange , blue , green |
C | orange , green , blue |
D | blue , green , orange |
E | green , blue , orange |
F | green , orange , blue |
Question 11 |
A | It will not affect aquifers. |
B | It may result in earthquakes. |
C | It is easier to frack on soft sediments. |
D | It is a relatively very new technology. |
Question 12 |
A | None of the answers are correct. |
B | ~ 0.20 |
C | ~ 3.50 |
D | ~ 4.00 |
E | ~ 0.64 |
Net sand interval = 3550 m - 1000 m = 2550 m (read off the GR curve)
Hence, net:gross = 2550 m/4000 m = 0.6375
Question 13 |
A | Formation must be clean and free of clay. |
B | Formation is completely saturacted with fulids. |
C | Proposity must be the same both above and below the oil-water contect. |
D | Oil and gas acts as conduits for electrical signals. |
E | Resistivity of the formation water is same above and below the contact. |
Question 14 |
A | In Alberta, we commonly find oil-wet rocks in the subsurface. |
B | In Alberta, lens traps are the most common type of hydrocarbon traps. |
C | Typically, as you move closer to mountains, frequency of structural traps increases. |
D | Computer algorithms for reservoir characterization models heavily depends on the analytical variables as opposed to empirical variables. |
E | Typically, as you move closer to mountains, frequency of stratigraphic traps increases. |
Question 15 |
A | the beds are extremly thick. |
B | the seismic signals have to travel through fluids (eg. oceanic seismic). |
C | there are multiple sleeply dippinng beds. |
D | the beds has no dip, hence almost horizontal. |
Question 16 |
A | To reduce fractures near the neck. |
B | To protect aquifers from contamination. |
C | To prevent well blowouts. |
D | To provide support for the Kelly Bushing. |
Question 17 |
A | ~ 40 cm |
B | ~ 10 cm |
C | ~ 30 cm |
D | ~ 80 cm |
Question 18 |
A | 4D seismic |
B | 3D seismic |
C | 4C seismic |
D | 2D seismic |
Question 19 |
A | Carbohydrates and Proteins |
B | Carbohydrates, Proteins and Lipids |
C | Proteins and Lipids |
D | Lignin and Carbohydrates |
E | Lignin, Carbohydrates, Proteins and Lipids |
F | Proteins and Lignin |
Question 20 |
A | Valleys |
B | High net pay regions |
C | Hills or mountains |
D | Low net pay regions |
E | High concentration of hydrocarbons |
Question 21 |
A | 0.5 - 1.5 m |
B | 0.5 - 2m |
C | 0.8 - 1.5 m |
D | 1 - 5 m |
E | 2 - 3 m |
Question 22 |
A | Pore stucture is directly related to the formation factor. |
B | Formation factor is inversly related to tourtousity factor. |
C | Porosity and formation factor is directly related to each other. |
D | Clean granular formations have a lower formation factor than clean carbonate formations. |
Question 23 |
A | 120.0 Ωm |
B | 0.102 Ωm |
C | 9.80 Ωm |
D | 102.0 Ωm |
Question 24 |
net sand = 15.5 m
shale = 5.3 m
gross thickness = 26.3 m
A | Net:Gross = 59 and Sand:Shale = 34 |
B | Net:Gross = 0.79 and Sand:Shale = 0.34 |
C | Net:Gross = 59 and Sand:Shale = 29 |
D | Net:Gross = 0.59 and Sand:Shale = 0.34 |
E | Net:Gross = 0.59 and Sand:Shale = 2.92 |
Question 25 |

A | Section 10 |
B | Section 5 |
C | Section 3 |
D | Section 9 |
E | Section 4 |
Question 26 |
A | All or other things being equal, increase in m will result in decrease in a. |
B | All or other things being equal, increase in m will result in increase in formation factor, F. |
C | The m and porosity are directly related to each other. |
D | Value of m is independent of the surface area of the pores. |
E | All or other things being equal, as m increases, the prore geometry become complicated. |
Question 27 |
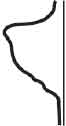
A | low , high , arbitrary |
B | low , high , at 15 API |
C | high , low , at 75 API |
D | high , low , at 15 API |
E | high , low , arbitrary |
F | low , high , at 75 API |
Question 28 |
A | 12% |
B | 6% |
C | 15% |
D | 5% |
E | 10% |
Question 29 |
A | 2 MHz |
B | 100 kHz |
C | 200 Hz |
D | 2 kHz |
E | 20 MHz |
Question 30 |
A | Unaltered organic matter |
B | Zone of gas formation |
C | Diagenesis |
D | Catagenesis |
E | Initial burial |
Question 31 |
A | carbon-oxygen chains. |
B | reservoir. |
C | kerogen. |
D | hydrocarbons. |
E | traps. |
Question 32 |
A | It will reduce viscosity of crude oil hence allowing it to be pumped. |
B | Increase pressure within the chamber hence driving the crude oil out of the system. |
C | Increase pressure within the chamber which facilitate extraction. |
D | Decrease friction between the pore walls and the crude oil. |
E | Increase the conductivity between pores. |
Question 33 |
A | increase , increase |
B | decarses , decrease |
C | increases , decrease |
D | They are not related to each other. |
Question 34 |
A | Very low formation pressures. |
B | Very high porosity in the formation. |
C | Very high permeability in the formation. |
D | Very high formation pressures. |
Question 35 |
A | Neuron log |
B | Caliper log |
C | Sonic log |
D | Gamma ray log |
E | Dipmeter log |
Question 36 |
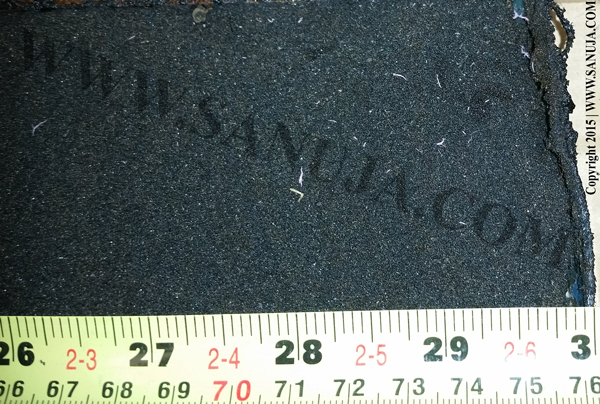
A | This part of the core is most likely concentrated with bitumen. |
B | This part of the core is most likely saturated with hydrocarbons. |
C | This part of the core is most likely saturated with organic materials. |
D | This part of the core is most likely have a very high permeability. |
E | This part of the core is most likely have a very low permeability. |
F | This part of the core is most likely harder and stronger relative to other areas of the core. |
Question 37 |
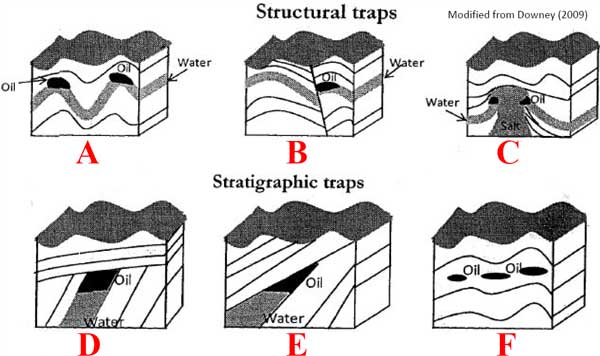
A | Lens trap |
B | Pinchout trap |
C | Anticline trap |
D | Fault trap |
E | Salt dome trap |
F | Unconformity trap |
Question 38 |
A | Well diversion trajectory angles. |
B | Length of the drill string. |
C | Porosity and permeability of the core. |
D | Total length of the recovered core. |
Question 39 |
A | is most commonly found to be equals to 1.0. |
B | is highly dependent on the formation factor. |
C | varies between 0.35 and 4.5. |
D | is directly proportional to the resistivity. |
Question 40 |
A | None of these answers are correct. |
B | The play is an area of interest for petroleum exploration while the prospect is an area within a play that is expected to produce hydrocarbons. |
C | The play is a large area where hydrocarbons may be found, while the prospect is an area where there is a current production in hydrocarbons. |
D | The play is an area of interest for petroleum exploration and a prospect is the lowest point on the trap which can hold petroleum. |
E | The play is an area where common petroleum system characteristics exists, while the prospect is an area where the hydrocarbons can be extracted economically. |
Question 41 |
A | Natural gas produced from reservoirs that are under very high pressures making it tight and easier to extract. |
B | Natural gas produced from reservoir rocks that are interbeded with alternating permeable and non-permeable layers. |
C | Natural gas produced from reservoirs after the peak production of the play. In other words, low yield gas produced after production has been in place for a period of time. |
D | Natural gas produced from reservoir rocks with such low permeability that massive hydraulic fracturing is necessary to produce the well at economic rates. |
Question 42 |
A | Core samples |
B | Geostatistical models such as kriging |
C | Gravity readings |
D | Seismic sections |
E | Wireline well logs |
Question 43 |
A | Denial-based mud |
B | Synthetic mud |
C | Acids-based mud |
D | Oil-based mud |
Question 44 |
A | carbon-hydrogen bonds. |
B | inorganic compounds. |
C | kerogen. |
D | transitional metals and carbons. |
E | carbon-oxygen bonds. |
Question 45 |
A | Neutron tools |
B | Gamma Ray tools |
C | Resistivity tools |
D | Density tools |
Question 46 |
A | ~ 1.5 m |
B | ~ 80 cm |
C | ~ 50 cm |
D | ~ 2.5 m |
E | ~ 3 m |
Question 47 |
A | ~30 to 50 cm |
B | ~ 26 to 30 cm |
C | ~ 1.1 to 2 m |
D | ~ 1.2 to 1.25 m |
E | ~ 1.35 to 1.75 m |
Question 48 |
A | F = 0.2 |
B | F = 0.5 |
C | F = 2.2 |
D | F = 0.7 |
E | F = 0.9 |
Question 49 |
A | Low viscosity mud. |
B | Directionally focused tools. |
C | High concentration of formation fluids. |
D | Low mud invasion zone. |
Question 50 |
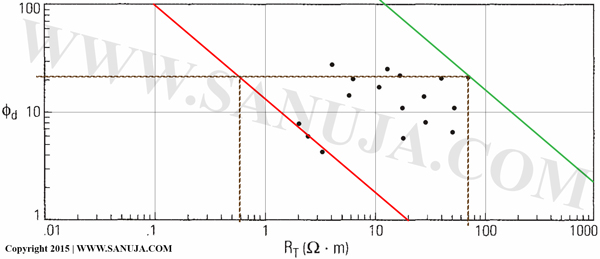
A | Rw is obtained from the upper boundary (green line above) and the Sw is obtained from the upper limit of the lower boundary (red line above). |
B | You cannot take these measurements from a Pickett Plot. You must use a well log to determine such properties. |
C | Rw is obtained from the upper limit of the lower boundary (red line above) and So maximum is obtained from the upper boundary (green line above). |
D | Rw is the intersect point between the lower boundary (green line above) and read off the x-values straight down (first brown dash line down). The So maximum is the x-value of the upper most point and read off the x-axis (second brown dash line). |
E | So maximum is the intersect point between the lower boundary (green line above) and read off the x-values straight down (first brown dash line down). The Rw is the x-value of the upper most point and read off the x-axis (second brown dash line). |
Question 51 |
A | ...the formation is saturated with fresh water. |
B | ...the formation is concentrated with clay minerals in saline waters. |
C | ...the formation is low in clay minerals. |
D | ...the formation is composed of highly complex pore structures. |
Question 52 |
A | Appraisal |
B | Production |
C | Development |
D | Exploration |
E | Reserves Growth |
Question 53 |
A | Progradating marine shelf |
B | Deep marine sediments |
C | Fluvial point bar deposits |
D | Progradating delta deposits |
Question 54 |
A | Beach marine |
B | Tidal flats |
C | Point bars |
D | Deep marine |
Question 55 |
A | 0.65 |
B | 0.08 |
C | 1.08 |
D | 1.00 |
E | 0.09 |
Question 56 |
A | Highest point of the hydrocarbon pool |
B | Lowest point of the hydrocarbon pool |
C | Bottom of the major formation |
D | Position of the Kelly Bushing |
E | Top of the major formation |
Question 57 |
A | Epi-thermal phase of the scatter |
B | Uranium source |
C | Electric energy |
D | Thermal phase of the scatter |
Question 58 |
A | Increase with sand interbedding. |
B | Decrease with increase in clay interbedding. |
C | Becomes almost zero with hydrocarbon saturation. |
D | Decrease with increase in hydrocarbon saturation. |
E | Decrease with depth. |
← |
List |
→ |
| 1 | 2 | 3 | 4 | 5 |
| 6 | 7 | 8 | 9 | 10 |
| 11 | 12 | 13 | 14 | 15 |
| 16 | 17 | 18 | 19 | 20 |
| 21 | 22 | 23 | 24 | 25 |
| 26 | 27 | 28 | 29 | 30 |
| 31 | 32 | 33 | 34 | 35 |
| 36 | 37 | 38 | 39 | 40 |
| 41 | 42 | 43 | 44 | 45 |
| 46 | 47 | 48 | 49 | 50 |
| 51 | 52 | 53 | 54 | 55 |
| 56 | 57 | 58 | End |
Credits: Based on the excellent class notes provided by, Dr. Stephen M. Hubbard during Winter 2015
FAQ | Report an Error
If you get a question wrong, you can still click on the other answers. You have multiple opportunities to select the correct answer. This will open up hints and explanations (if available), which will provide additional information.