For someone who is new to Geology, reading highly technical maps could be a challenge. I remember even I had trouble reading data off of maps when I was in first year Geology class. It is nothing to be shamed of because I know even the most seasoned Geologists who read their maps wrong. But the difference between a skilled Geologist and a lay person is that a Geologist would be able to find his/her own mistake. This article will introduce you to the most fundamental aspects of Geologic maps.
Monthly Archives: May 2013
Whose fault is that?
No, I am not going to finger point. This is about Geological faults and not about your faults. Joke aside, the different types of fault anatomies are very impotent for understanding the nature of the fault, it’s history and the even the future. The Structural Geology is one of the branches in Geoscience in which scientists are specifically concerned about the fault propagation and the anatomy. The behaviors of faults are important structures for industry (specially energy) and for urban planing. For those of you who are not familiar with Geology, this article may provide some insight into fault structures in general. I am not going to discuss the techniques of fault analysis, because my goal is to educate the general public. But if you are a “Geology minded” person, pleased read Fault Displacement Vectors for more in-depth view.
Structures Tell a Story
The structures we observed in the field records the history of geologic activities of the past and may provide insight into the future. For example, based on structures in the San Andreas Fault, today we know it’s sense of movement, history and we can predict the future.
For someone who is new to Geology (like the undergrad students), hands on experience may not be an option due to logistics (specially if you live in countries which cannot afford to send you out to the field). But don’t get discourage we can use rock samples with fault structures to widen our understanding of faults. Before the GPSes (Global Positioning System) are used to track and record movements of materials, we were able to determine the history using slickensides, type of rock, geologic features and many other variables. They are still in use today because those fundamentals have always proven to provide an accurate picture. In fact, these so called “old methods” are useful when you don’t have physical access to a site. Today even large companies that outsource the geologic work sometimes send samples to a lab, rather than taking their professional to the field.
Different structures, a lot of information
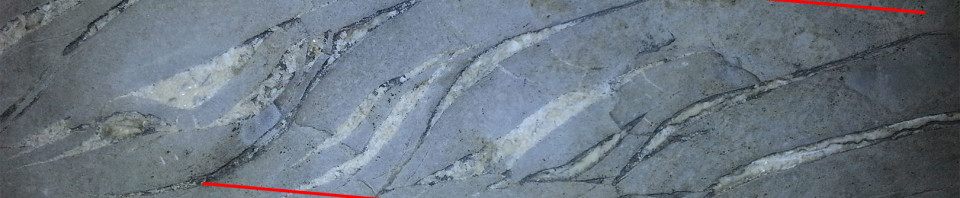
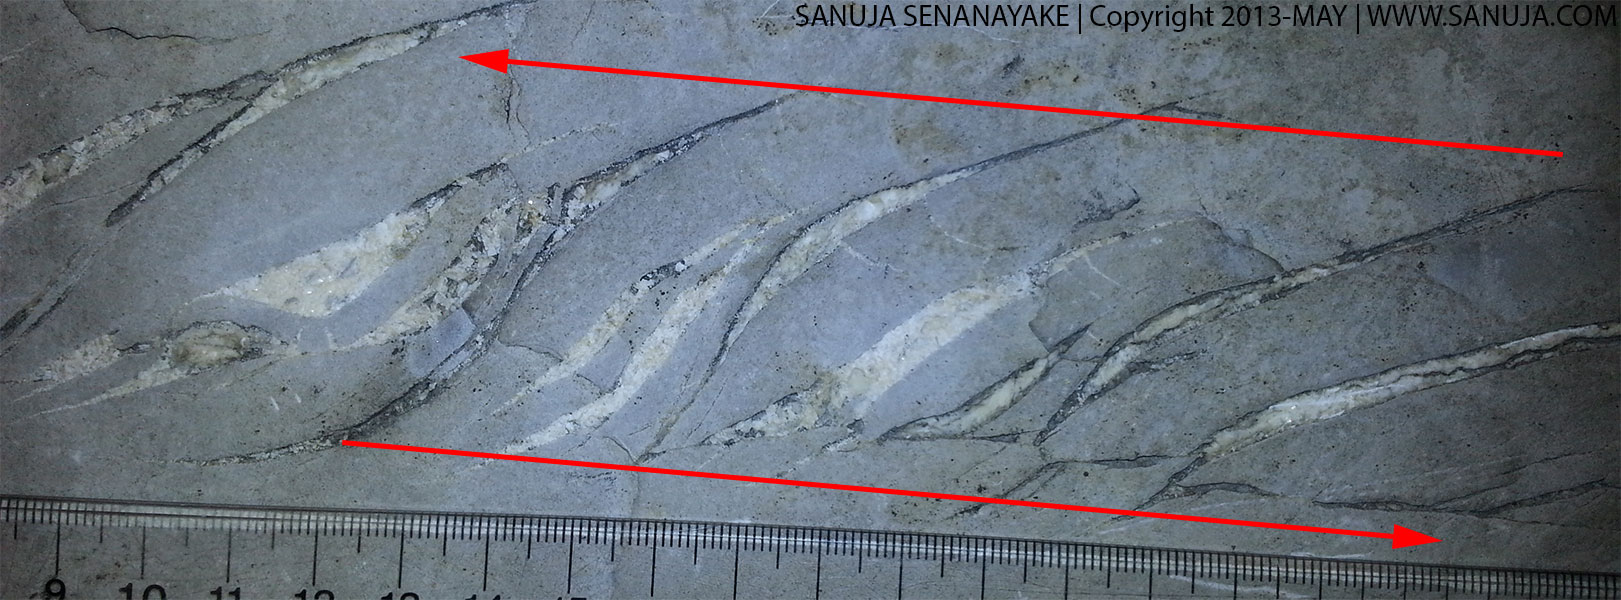
Tension gashes are develop as a result of differential stress within the fault zone and useful for determining the orientation of principle stresses and the sense of movement. It usually form a “S” or “Z” shaped structures. On a vertical plain, if the gash is like and “S”, the top block is moving to the left. If the gash is like a backwards-S then the top block is moving to the right.
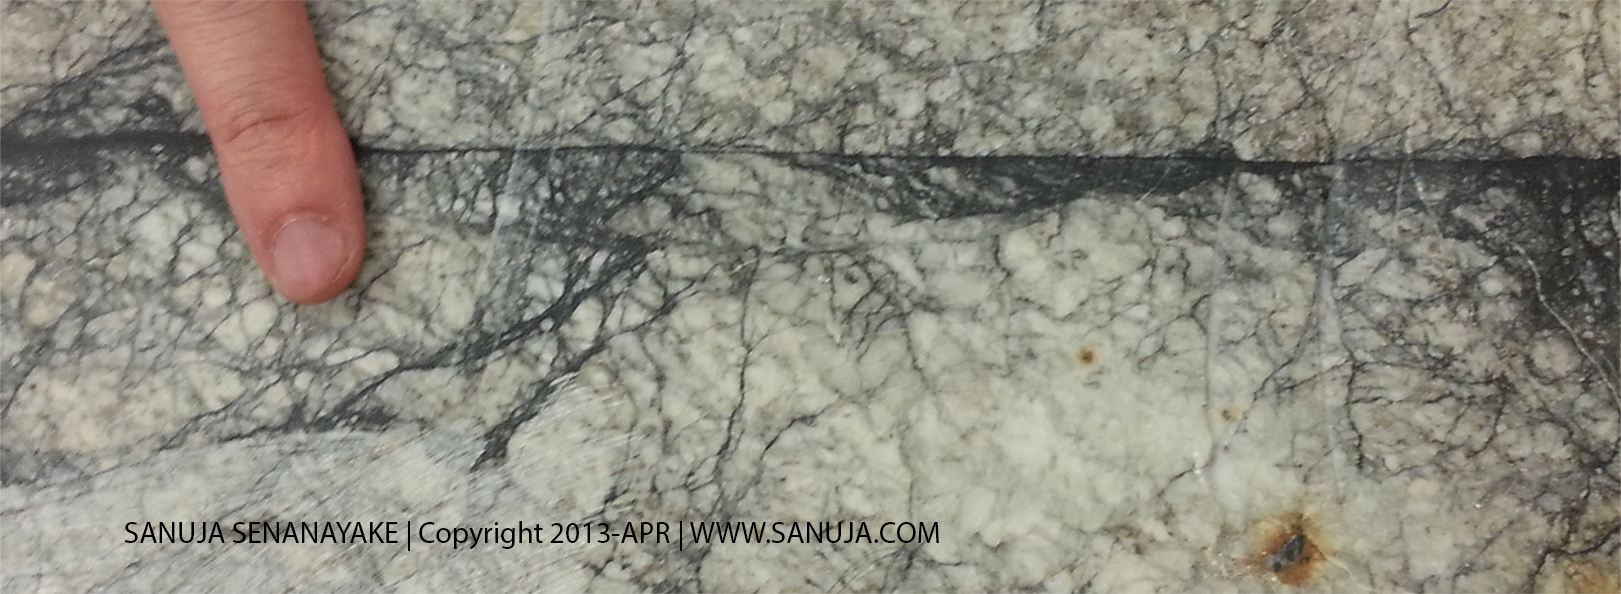
Pseudotachylite are another type of structure which they form as a result of flash melting. The friction and the tension within the fault, causes rock surface in the fault to melt. These melted materials spread along the fault and injected into the two fault blocks. They are fined grained material and are used to identify fault zones. However, they are not always a common occurrence in fault zones. You will most likely come across tension gashes than this type of structure.
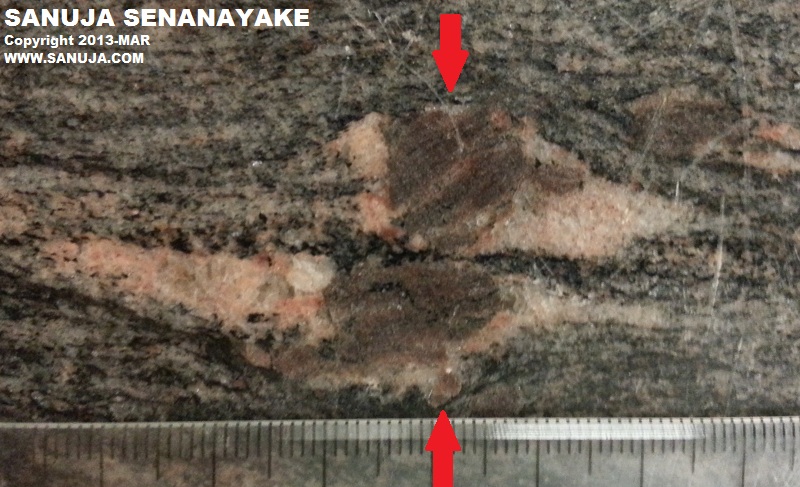
Pressure shadows can be used for understanding the force regimes. These indicate the direction in which the maximum magnitude of the compressional forces are acting on a rock body.
I will update this page with few more geological characteristics of faults. Until then, happy georgasm!
Visual Basic Script using the Interface
This is the second article a ongoing series of VB scripting guide. If you are unfamiliar with programming in Microsoft Excel, don’t be afraid, start your journey into VisualBasic with basics of VB explained here.
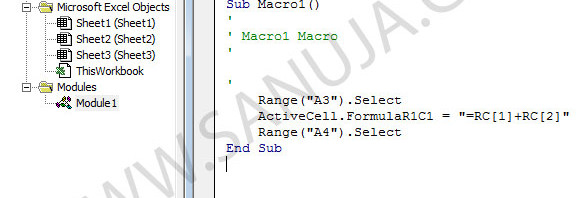
Macro recorder is great for those who are new to the coding in general. A user can utilize the graphical front end of Excel to generate Modules, which can be modified using conventional VBA Editor.
Equations for Geologists and Engineers
There are many different formulas we use in Geology, Engineer, Science and Math. However, over the years, I found the following equations to be the most useful ones for high school and undergraduate Geology and Geological Engineering Students.
Atomic and Quantum Mechanics
Kinematics and Dynamics
Energy and Momentum
Electric and Magnetic
Waves and Light

![]()
![]()
Mohr’s circle