A well log, also known as a petrophysical log is similar to a cardiogram, which records electrical activity of your heart. An electrocardiogram (EKG or ECG) does not provide answers to hearth problems. It provides an outlook into the state of the heart. The EKG is interpreted by a medical doctor to provide solutions to heart problems.
A well log records physical, chemical and other petrophysical properties of rocks and lithological units (facies)1 in the subsurface. It does not provide definite answers. But just like an EKG, a well log can be analyzed and interpreted by Geoscientists (Geologists and Geophysicists) and Engineers to find natural resources. Well logs are very similar to EKGs in that they also provide multiple graphs measuring various parameters (properties) of interest. In fact, the well logs do not measure or identify petrophysical properties; the properties are interpreted by professionals.
A skilled interpreter can use limited number of well logs from a single location to; determine different lithological units, locate hydrocarbon rich regions known as pay zones, locate water saturated zones, characterize fracture types and orientations, locate depth intervals of different geological formations, analyze borehole conditions such as temperature, etc. Meanwhile, well logs obtained from multiple wells at different locations in a defined region are used to; characterize and evaluate petroleum reservoirs, model hydrocarbon fluid migration pathways, determine overall depositional environment (important to natural deposits), etc.
Well logs are mostly used in the petroleum industry. Additionally they are also used in other areas such as in seismic stability evaluations by USGS2, geothermal exploration, mineral exploration and subsurface research into lithological facies.
How is it obtained?
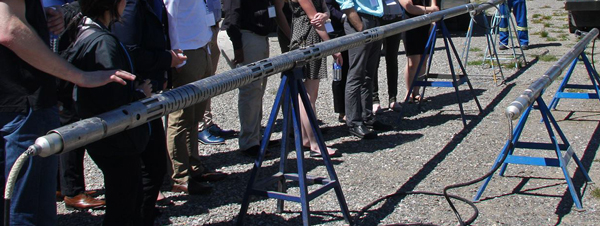
There are two methods of obtaining well log data; after the borehole has been drilled and during the drilling process. If we are measuring properties after drilling, you make a well just like drilling for freshwater, remove the drilling tools and lower the well logging equipment. However, today the most used method is logging while drilling (LWD). In LWD, we place the logging equipment right above the drill bit, known as the bottom hole assembly (BHA), and obtain data as we drill. This is more efficient and allow us to make adjustment to drilling schedule3. The BHA and related components also referred to as the “drilling string”.
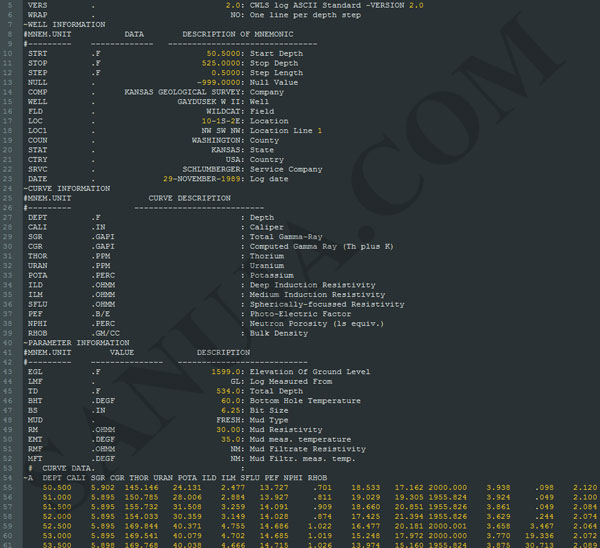
Multiple log measurements can be collected in a single run. Most companies would run as many measurements as possible and the data will be stored in the LAS (Log ASCII Standard) file format. LAS is a 3D industry-standard format for storing well log data as numerical values. LAS can be thought of as a compressed version of a large dataset. These files have just numbers and few texts (in the header). The LAS files are converted into graphical well logs using software like GeoScout, AccuLogs and PowerLog for geological and engineering evaluations.
Regardless of the chosen method (logging after drilling vs LWD), measured data is typically transmitted to a computer using electrical wires, hence the term “wireline logging”. In most petroleum drilling operations in Alberta, Canada, scientists evaluate well logs in real time (LWD) at well sites. The real time evaluations are used to make “corrections” to the drilling schedule.
Brief History
Even before the petroleum industry boosted the importance of well logging, geologists in 17th and 18th century have recorded observable geological properties. These records are lithological diagrams or stratigraphic interpretations. They are detailed drawings of exposed earth surfaces. For example, the father of modern geology James Hutton sketched eroded outcrops and described physical properties using geological terms.
The first major step towards the modern day well logging occurred in the 1800s. In early 1800s, the oilfield workers wrote down what they observed at various depths. The data was detailed, but not precise. They include, problems, types of formations, drilling speeds at various intervals and encounter of water or hydrocarbons.
The Engineers Conrad Schlumberger and Marcel Schlumberger in the early 1900s came up with the next major step for well logging. They used electrical measurements to map the subsurface. Their first log was an electrical resistivity measurement made in 1927. They are the pioneers and founders of the now famous Schlumberger Limited well servicing company.
Types of Logs
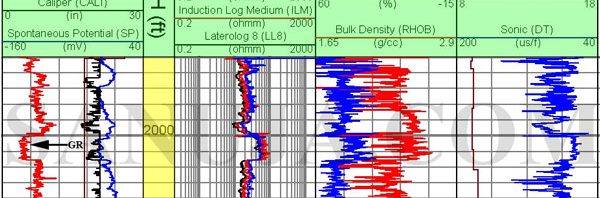
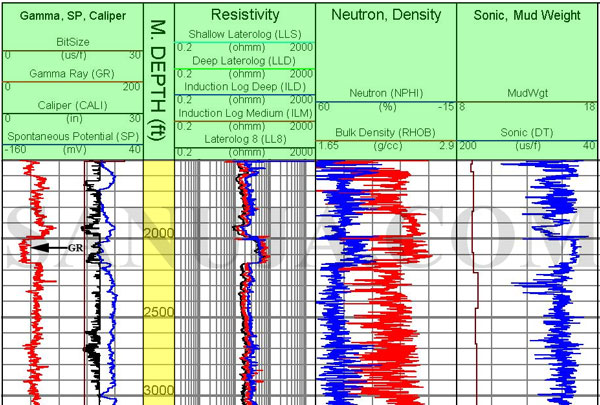
Today we use multiple types of logs. In addition to improved 1927 style resistivity (RS) logs, we also use gamma ray (GR) logs, neutron density logs (Phi-D, Phi-N, Bluk), photoelectric (PEF) logs and few others.
Some logs are used for analysis of borehole conditions instead of lithology. Caliper log and temperature log for example are used for determining the stability of the borehole and the formations immediately next to the drilling surface. These parameters are important in preventing disasters such as borehole collapse and well blowouts.
Resistivity (RS): Resistivity is often used in mineral exploration because it relies on ability to flow current through a formation. Higher metallic minerals often result in lower resistivity readings.
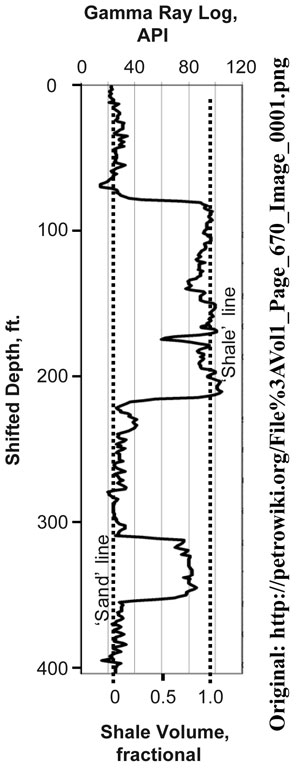
Gamma Ray (GR): Very useful in identifying sandstone regions. Low GR reading indicates sandstone. Sandstones are associated with higher porosity hence have the possibility to contain hydrocarbons.
Density: Used for identifying natural gas saturated zones. When logged as a combination of Phi-D and Phi-N, a crossover between the curves usually means gas saturation.
Photoelectric (PEF): Often used for identification of different types of minerals such as anhydrites.
Sonic: Sonic response decreases with high effective porosity and permeability. It can also use for identifying lithology and rock textures.
Formation properties can be derived at a higher accuracy with multiple types of logs. Therefore, we use multiple logs recorded at the same time at the same location when analyzing formations. For example, having a localized high gamma ray (GR) response indicates a sandy deposit, which is associated with hydrocarbons. However, majority of sandy deposits have no hydrocarbons. If the high GR response occur at the same location as Phi-D and Phi-N logs crossover, it indicates economically significant gas bearing sandy deposits.
Wireline Logging
In petroleum industry, wireline logging is used for real time monitoring of borehole conditions and formation properties. LWD wireline logs are instrumental in directional (horizontal) drilling operations. As mention above variety of logs can be created using LWD method depending on the budget and circumstances.
Well Log
A well log has the following components;
– Well identification information
– Calibration information
– Header with scales (well ticket may also be called header)
– Log response
– Interpretations
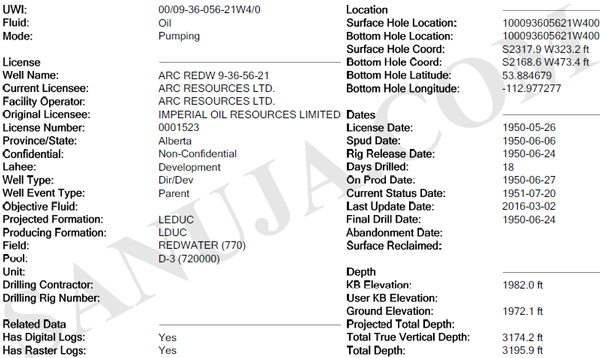
Another piece of important information is stored in a separate file called a well ticket (or scout ticket/header). A well ticket is almost always a detailed document on history and technical information of each well.
Why use well logs?
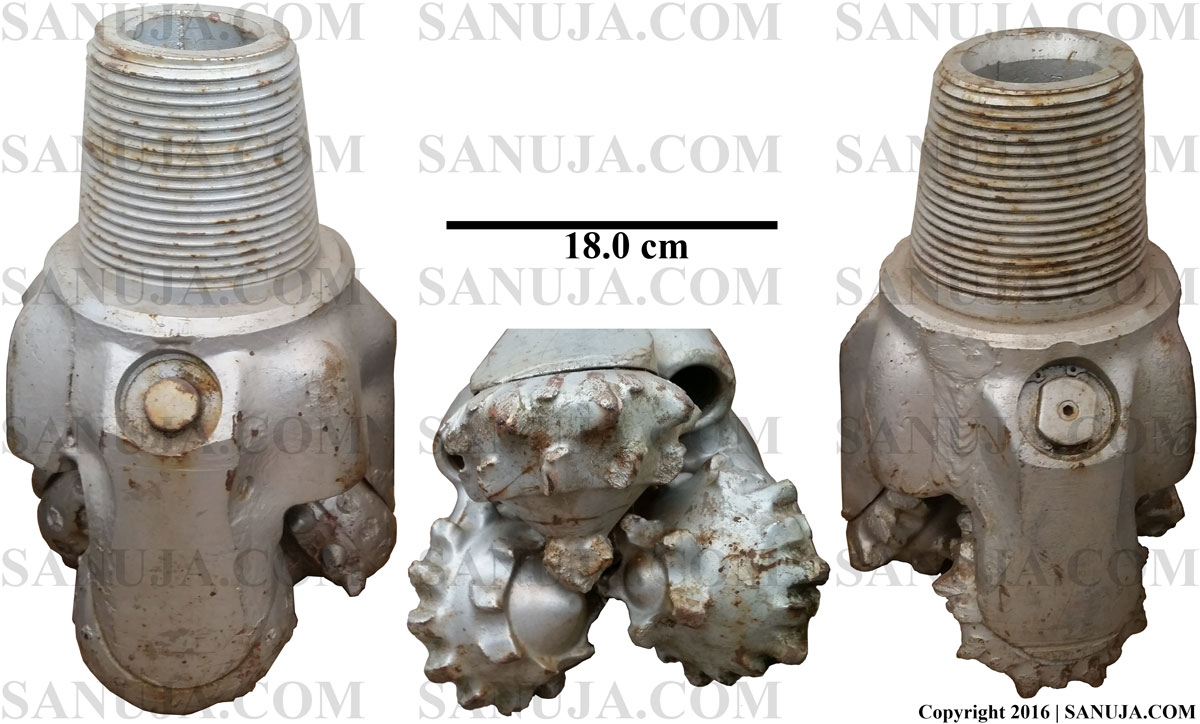
Well logs are cheaper, efficient, and can be used in conjunction with variety of other data sets. The alternate method to well log analysis is the core samples analysis. It is cheaper to obtain wireline well logs than to drill wells with dedicated coring tools (figure below). Drilling using coring bits result in much slower penetration of subsurface. In most cases, companies drill using regular drill bits (figure above) to target location and replace the drilling bit with a coring bit. In essence, this increase the cost of the drilling operation especially for deep wells. In Alberta for example, we have relatively very deep wells hence LWD is a popular alternative.
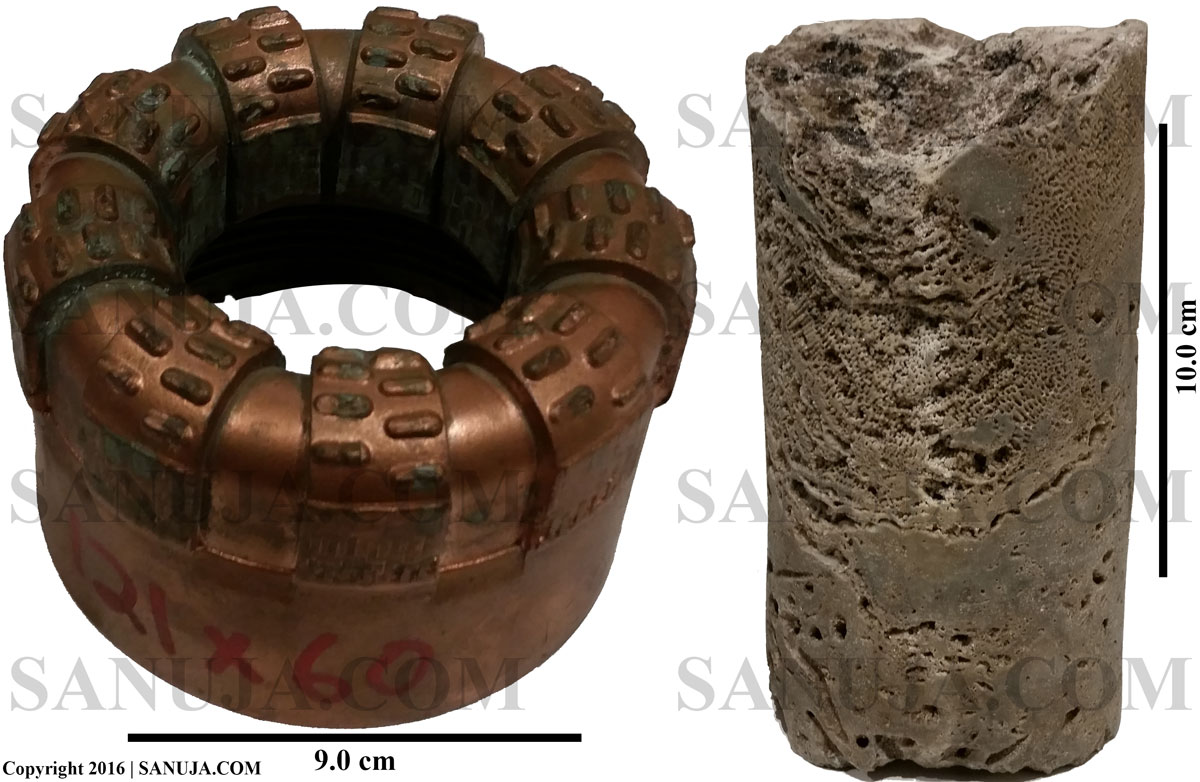
The cores must be brought up to the surface for analysis in pristine condition to obtain any valuable information. This is often difficult to do because cores with soft sediments is easily get damaged due to pressures within the borehole. The hard sediments can undergo fracturing due to vibration of drilling equipment, curvature (directional drilling) of the borehole, etc. Therefore, core samples can be damaged by drilling itself. What we are after is natural properties such as factures that allow hydrocarbon deposits to migrate towards the borehole. Logging data with correct processing methods can separate natural characteristics from the artificial ones caused by drilling. Hence well logs in majority of cases are very useful in obtaining true natural sediment/rock characteristics.
Well logs allow real time formation evaluation (using LWD logs). This is useful in making corrections to borehole drilling schedules (or make the decision to abandon well). For example, if a target formation happened to be at a different depth than expected, an evaluator of LWD well logs should be able to take corrective actions in real time. Core log analysis may takes few hours to days while LWD analysis may take few minus to few hours. In fact, most companies would change the drilling direction (angle), drilling speed, mud injection rates, etc in real time based on well log data. Almost all directional (horizontal) drilling operations use some form of LWD logs to control the direction of drilling known as geosteering.
Another benefit is that well logs take less resources for storage and logistics (just need a low powered and often low capacity computer server) than core samples. Cores would require climate controlled storage facilities, which cost money and resources.
Additionally, once the data are captured, well logs can be reevaluated for further exploration of natural resources with minimum cost to the company. For example, company A will run out of ideas and funds to extract oil and gas. Then the company A will sell rights of natural resources to company B. The company B often inherits old well logs from company A. But with better technologies and expertise, the company B may turn around the field into a producing site by reevaluating the well logs. In North America, companies also share data and work together through farmout agreements4.
There are many other benefits of using well logs. With the advancement in technology and well log interpretation methodologies, the future looks bright for the well logging (petrophysical logging) industry.
Learn more…
This article is written for students who are in high school, geoscience and engineering (junior level). The well logging is a broad academic and industry discipline. Universities and colleges have full credit classes for petrophysical well log analysis.
If you are interested in this subject matter, you should research these important concepts that are not covered in this article; tool design (electrical, mechanical, robotics engineering), drilling mud evaluation/manufacturing (geology, chemical engineering), software/computation (software engineering, computer science), reservoir characterization (geology, geophysics, engineering), borehole completion (geology, engineering), etc.
If you would like to practice your skills on interpreting well log I have few questions here; Petrophysical Log Interpretation. You can also see what different logs looks like on that questions database.
Footnotes:
1. Lithological facies: A facies is a rock unit with specific characteristic. It is important to all industries because some facies have a higher probability of containing natural resources than others. Facies analysis also allow us to determine fractures and other fluid migration pathways, which can be used for extraction of natural resources (including freshwater).
2. USGS: The United State Geological Survey has carried out several borehole studies in seismically active regions to recommend better civil and construction engineering standards.
3. Drilling schedule: It is like a manual that is specific to each well. It contains information regarding, drilling rate (speed), direction of drilling (or angle), borehole evaluations, etc. It is usually prepared by a team of Engineers, Geologists and sometimes Accountants or Business Analysts to maximize profitability while reducing costs of a well.
4. Farmout agreements: a type of mineral rights leasing agreement widely practiced in Canada and the United States. Read more here.