Special thanks goes to Dr. Bernard Guest, Cassie Vocke and Alex Meleshko
Given,
and the failure envelope with a x-intersection of -10 MPa with 30o angle between the failure plain and the x-axis;
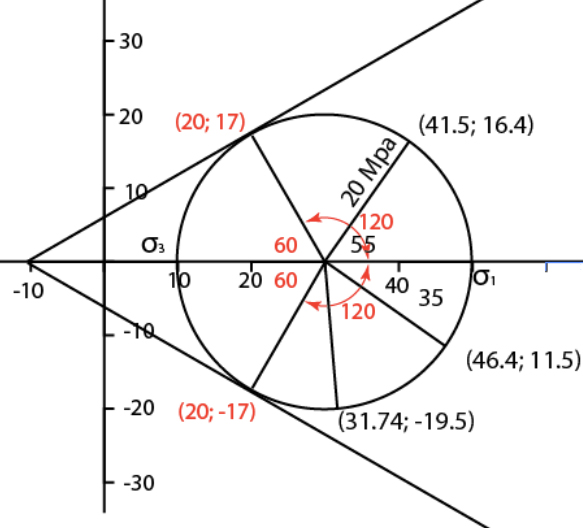
A) Draw the Mohr diagram and orientation of principle stresses on the block diagram.
B) Determine the magnitudes and trends of the principal stresses.
C) Given that the rock is critically stressed, determine the orientations of the resulting fractures.
D) Determine the magnitudes of the stresses acting on the fractures.
Step 1: Two points
Determine your two points based on right lateral/left lateral for the y-coordinate and compression/tension for the x-coordinate. The sign (+/-) of the coordinate is determined based on the direction of the applied force (read more here)
Step 2: Center Point
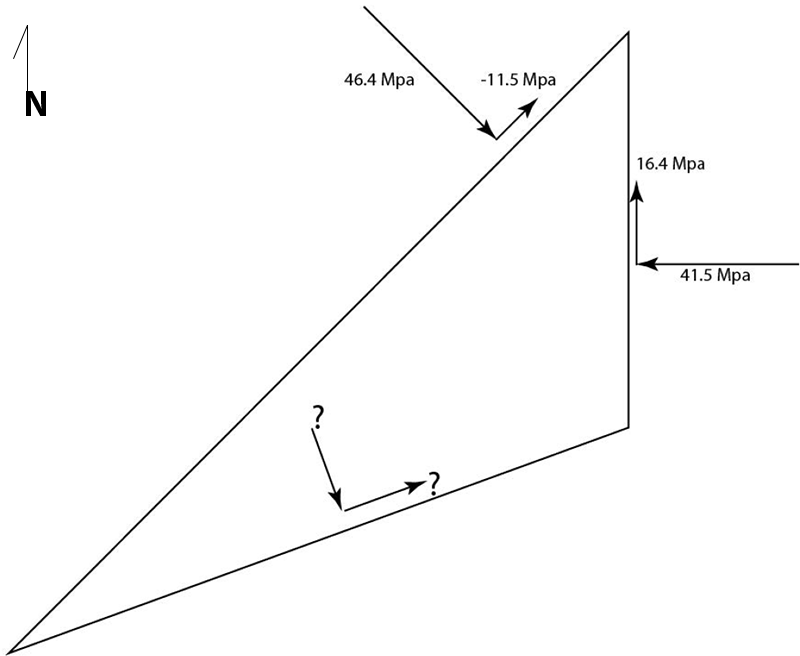
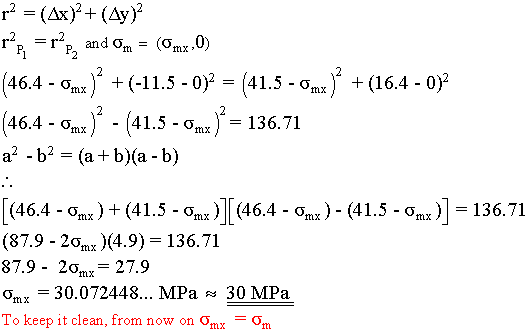
Based on the above diagram, there are two points that lies on the circle; (46.4,-11.5) and (41.5,16.4). Using the equation of a radius, two separate equations can be written for the each point. Since both points are on the same circle and have a common mid-point (also an exact same radius), equate the two equations to isolate σm(mid –point).
Equation of a radius can be written as:
The center of the Mohr circle must be on the x-axis (y = 0), we already know one value of the midpoint. Therefore,
It turns out to be 30 MPa.
Step 3: Deviatoric stress, σ1 and σ3
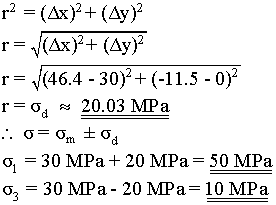
These can be calculated by either adding or subtracting the radius from the mid-point (Step 2). σ1 is calculated by adding the mid-point to the radius and the σ3 is calculated by subtracting from the radius. On Mohr Circle, the radius is the deviatoric stress.
To solve for the radius, either point on the circle can be used. For the following illustration, the point one, (46.4,-11.5) is used.
Therefore, deviatoric stress calculated to be 30 MPa, the σ1 is calculated to be 50 MPa and sigma-3 calculated to be 10 MPa.
Step 4: Failure envelope
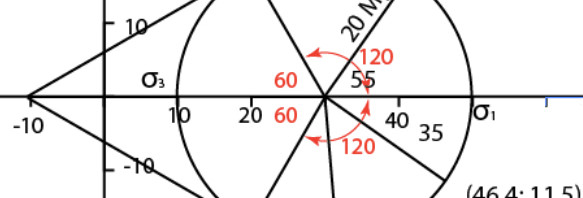
If the x-intercept and the angle of the envelope is given, then take + and – of the angle for the both sides to draw the failure envelope. In this particular example, it is given as the intercept of -10 and the angle of the envelope as 30-degrees.
Step 5: Fracture Points
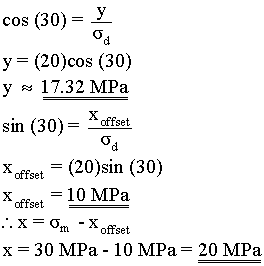
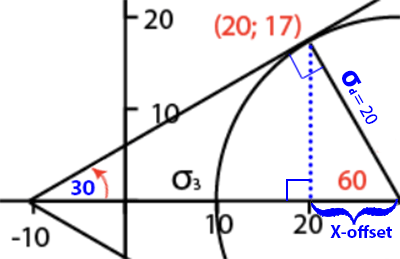
A tangent to a circle would always make a right angle between the tangent point and the arm to the radius(in this case it is the line between the critical point and center). Using this along with the given tangent line’s angle of 30-degree (envelope) and the calculated values in previous steps, we can now find the value for x and y intercepts of the critical point (Figure 2).
On the Figure 1, draw a line normal to the plane (perpendicular, aka 90-degrees). It does not matter which point is used as long as it is perpendicular. Now find the angle between that point (same as the point which used for the normal on the Figure 1) and σ1 on the Mohr Circle.
Step 6: Transfer of Data
Now transfer the angles on the Mohr Diagram to the physical 2D block (Figure 4). Remember the conversion factor of two. The angles in physical 2D or 3D space are half of what on the Mohr Diagram.
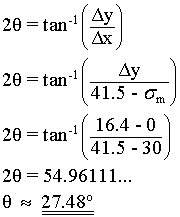
To calculate σ1 angle on the 2D diagram using the angle calculated based on the Mohr diagram (Figure 3). Using the first point, (41.5, 16.4);
For the failure angle,
It is +/- 60 degrees from the σ1 because there are two fracture points.
The 27.48 degree angle is in the clockwise direction from the normal to the right hand plane (plane which this point is taken). Since σ3 is orthogonal to σ1, we can draw the σ3 as well.
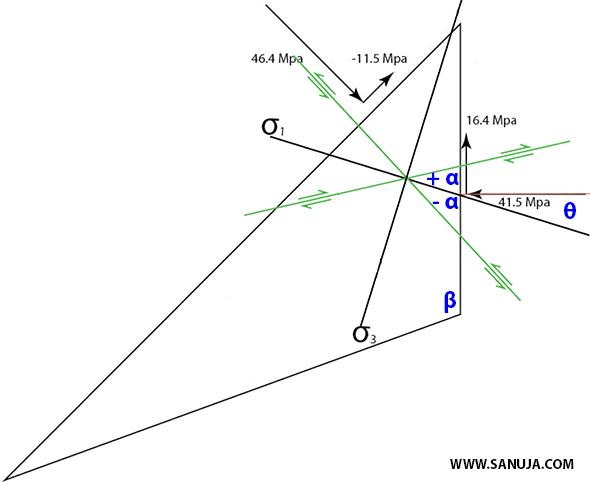
Measure the angle on the Figure 4 in the same direction as we measured on the Mohr diagram. Now we have the σ1, draw a line perpendicular to it, which is σ3. Now using the navigational protractor measure the angle of σ1 from the North. This is the trend.
The β angle should be read between the vertical plane and the bottom one from the figure (using a protractor). It was measured to be 110-degrees and in Mohr space it is 220-degrees from one of the plane. Depending on which direction you measured on the 2D block, take the angle appropriately. The point of this angle should have (31.74,-19.5) for its coordinates. This coordinate translates onto the 2D block as normal stress of 31.74 MPa and a shear stress of -19.5 MPa on the bottom plane.
