Notice
This is the non-interactive basic mode of ECON 201 questions database for printing or use in case of SQL database failure on main site. All the questions and answers are identical except the order of questions and answers. Please use the interactive version for more up to date materials.Please use the interactive version for more up to date materials.
Economics (ECON 201-UCAL) Midterm Exam
1. Which of the following best describes Microeconomics? (ID-MI1-01)
A. The study of small industries and companies.
B. The study of household centered economic systems.
C. The study of overall production and consumption.
D. The study of behavior of individual agents and markets.
2. When the production of goods are inadequate to fulfill the needs of a society, the economy is… (ID-MI1-02)
A. most likely a Capitalist one.
B. a failure.
C. expanding.
D. most likely a Socialist one.
E. experiencing scarcity.
3. In Economics, the term capital is used to describe… (ID-MI1-03)
A. the amount of money grained from profits.
B. the amount of money invested.
C. the amount of created resources.
D. the main City in a country which produces the most goods.
4. In Circular Flow Diagram of physical and monetary flow, what is the input and output of firms? (ID-MI1-04)
A. Input: income and resource services
Output: commodities and consumption
B. Input: revenue and resource services
Output: commodities and costs
C. Input: commodities and costs
Output: revenue and resource services
D. Input: commodities and consumption
E. Input: commodities and consumption
Output: income and resource services
5. What major limitation is not considered in Circular Flow Diagram of physical and monetary flow? (ID-MI1-05)
A. human resources
B. non-renewable resources
C. capital costs
D. market fluctuations
6. The supply of Oranges exceeds the demand while the supply of Apples are hindered due to weather. Which of the following statement is true about this particular market? (ID-MI1-06)
A. The inflation rate will increase due to the shortage of Apples.
B. The price of Orange and Apples will increase.
C. The price of Orange will decrease as the Apples market is experiencing a s scarcity.
D. The price of Orange will increase as the Apples market is experiencing a scarcity.
E. The price of Orange and Apples will decrease.
7. What will eventually happen to an economy when resources are not allocated properly? (ID-MI1-07)
A. It will experience a rapid growth.
B. It will experience scarcity.
C. It will result in a market failure.
D. It will result in slow rate of inflation growth.
D. It will result in larger income gaps between the rich and poor.
8. In order to obtain a degree at the University of Calgary, you decided to give up your full time job. What is the best statement that describe your situation from Economics point of view? (ID-MI1-08)
A. The lost time and money from a full time job is the capital cost of obtaining an education.
B. The cost of obtaining an education is always beneficial compared to having a low paying full time job.
Hint: This may be true in most cases. But this is not applicable in all situations. For example; Bill Gates, Mark Zuckerberg, etc.
C. The lost time and money from a full time job is the opportunity cost of obtaining an education.
D. The time spent on studying and attending classes is the capital cost of obtaining an education.
E. The time spent on studying and attending classes is the opportunity cost of obtaining an education.
9. Canada was one of the few (if not only) countries to weather the financial crisis of 2007–08. What is the primary reason for Canada’s success? (ID-MI1-09)
A. Controls put in placed by the free market “invisible hand”.
B. Mark Joseph Carney, the Governor of the Bank of Canada.
C. Proper Government regulations on the free market economy.
D. International trade agreements between Canada and other first world nations, such as NAFTA.
10. The Alberta beef market to shrunk as during the Mad Cow Disease crisis. This is an example of what Economic property? (ID-MI1-10)
A. An example of the “invisible hand” in action.
B. Endogenous variables causing the market demand for beef to drop.
C. Externality causing the market to shrink during a crisis.
D. Market failure due to Alberta’s monopoly on the beef industry.
E. Exogenous variables causing the market demand for beef to drop.
11. What should be the unemployment rate of a sustainable and healthy Economy? (ID-MI1-11)
A. 30 – 35%
B. 40 – 45%
C. 0%
D. 4 – 6%
E. 15 – 20%
Question 11 Explanation: Ideally, 0% is the best option. Piratically no Economy (country) can maintain an unemployment rate of 0%.
12. What is Production Possibility Frontier or PPF? (ID-MI1-12)
A. It is a mathematical model used for calculating the per unit opportunity cost for a given item.
B. It is a graphical representation of the relationship between the output of products and the limited resources available to produce the products.
C. It is a mathematical model used for determining the inflation rate and its relationship to the unemployment rate.
D. It is a mathematical model used for determining the inflation rate and its relationship to the economic growth.
E. It is a graphical representation of the maximum output obtain from a given unlimited resource base.
13. Based on the following table, what is the opportunity cost of moving from D to E? (ID-MI1-13)
| Situation | Capital Goods | Consumer Goods |
| A | 0 | 2000 |
| B | 150 | 1750 |
| C | 300 | 1500 |
| D | 550 | 1050 |
| E | 700 | 500 |
| F | 950 | 0 |
A. 150 capital goods
B. 1050 consumer goods
C. 550 consumer goods
D. 550 capital goods
14. There are several points posted on the following Production Possibility Frontier (PPF) graph. The most efficient points are indicated by which letter(s)? (ID-MI1-14)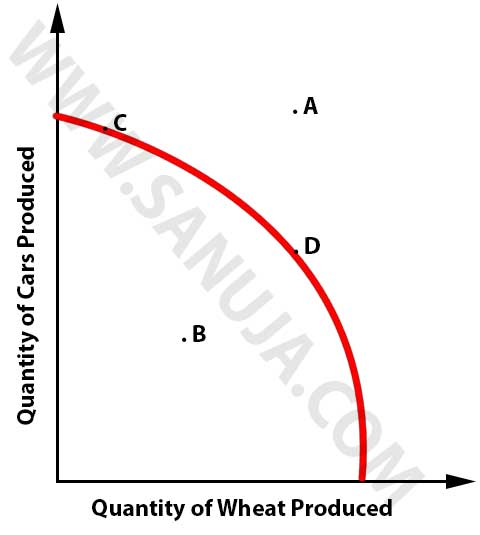
A. A
B. C and D
C. B
D. A and B
E. C
15. There are several points posted on the following Production Possibility Frontier (PPF) graph. The most inefficient points are indicated by which letter(s)? (ID-MI1-15)
A. C and D
B. D
C. B
D. A
E. A and B
16. There are several points posted on the following Production Possibility Frontier (PPF) graph. The situation(s) that is/are impossible to attain, indicated by which letter(s)? (ID-MI1-16)
A. B and C
B. A
C. A and B
D. B
E. C and D
17. Based on the following table, what is the opportunity cost of moving from C to B? (ID-MI1-17)
| Situation | Capital Goods | Consumer Goods |
| A | 0 | 2000 |
| B | 150 | 1750 |
| C | 300 | 1500 |
| D | 550 | 1050 |
| E | 700 | 500 |
| F | 950 | 0 |
A. 1/2 Consumer Goods
B. 300 Capital Goods
C. 150 Capital Goods
D. 300 Consumer Goods
18. Refer to the following diagram. The tax imposed is indicated by the neon-green vertical line. What is the consumer surplus without the tax? (ID-MI1-18)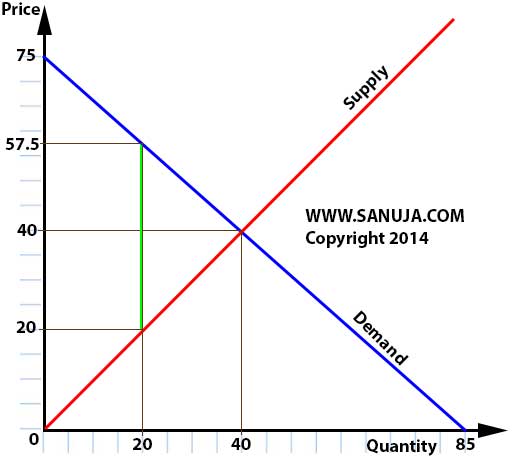
A. $3000
B. $1500
C. $700
D. $350
Question 18 Explanation: 40 x (75-40) x 0.5 = 700
19. Refer to the following diagram. The tax imposed is indicated by the neon-green vertical line. What is the producer surplus without the tax? (ID-MI1-19)
A. $800
B. $350
C. $1500
D. $700
Question 19 Explanation: 40 x (40-0) x 0.5 = 800
20. Refer to the following diagram. The tax imposed is indicated by the neon-green vertical line. What is the total tax revenue? (ID-MI1-20)
A. $750
B. $35.5
C. $650
D. $57.5
E. $20
Question 20 Explanation: (57.5 – 20) X 20 = 750
21. Refer to the following diagram. The tax imposed is indicated by the neon-green vertical line. What is the deadweight loss (DL) due to tax incidence? (ID-MI1-21)
A. $375
B. $710
C. $35.5
D. $53.5
22. The absolute advantage is measured primarily by what factor? (ID-MI1-22)
A. The capital needed to produce an item.
B. The number of items produced.
C. The all inputs needed to produce an item.
D. The added costs such as taxes and transportation fees.
Question 22 Explanation: Tricky question because you must know the exact definition of absolute advantage (AA); lowest inputs needed to produce one unit of an item.
23. Increase in price of bread from $2.50 to $3.20 will increase the supply from 800 to 1250 units. Using midpoint (arc) method, what is the elasticity of supply? (ID-MI1-23)
A. 2.00
B. 1.79
C. 2.31
D. 1.55
E. 0.55
Question 23 Explanation: midpoint (arc) = [(change in Q)/(change in P)] X [(sum of P)/sum of Q)]
24. Given that the price elasticity of demand for a good is 4.5, what is the change in quantity demanded if the price is increased by 15%? (ID-MI1-24)
A. 6.75% increase
B. 0.675% increase
C. 67.5% increase
D. 4.5% increase
25. Refer to the following diagram. The tax imposed is indicated by the neon-green vertical line. What is the total revenue without tax incidence? (ID-MI1-25)
A. $1600
B. $800
C. $575
D. $710
E. $1150
Question 25 Explanation: 40 X 40 = 1600
26. If the entire Production Possibility Frontier shifted to higher values, it is most likely caused by… (ID-MI1-26)
A. …technological breakthrough in one of the two goods.
B. …increased in spending.
C. …decrease in demand for one product over the other.
D. …decrease in demand for the two products.
E. …technological breakthrough in both goods.
27. Which of the following product will have the most inelastic demand? (ID-MI1-27)
A. Penicillin antibiotics
B. Automobiles
C. University education
C. Oranges and bananas
Question 27 Explanation: Drugs such as Penicillin based antibiotics often have inelastic demand because they are essential ingredients in treating certain medical conditions.
28. Higher price for hotdogs will most likely… (ID-MI1-28)
A. …increase the demand for bananas.
B. …decrease the demand for hotdog buns.
C. …increase the demand for ketchup.
D. ….increase the equilibrium quantity.
Question 28 Explanation: According to the principles of “related items”.
29. What is the best definition for producer surplus? (ID-MI1-29)
A. The value of everything that a producer earns as a result of selling an item.
B. The difference between what the buyer’s willingness to pay minus the amount the buyer actually pays.
C. The amount a seller is paid by the buyer for a given item minus the seller’s cost.
D. The amount a buyer would gain before the tax being paid.
30. A government welfare system will increase the equity. (ID-MI1-30)
A. True
B. False
31. The fall in total surplus as a result of market distortion is known as… (ID-MI1-31)
A. …efficiency loss.
B. …a tax revenue loss.
C. …elasticity loss.
D. …deadweight loss.
32. Refer to the following diagram. The tax imposed is indicated by the neon-green vertical line. If the demand line is steeper(let’s say the intercepts are 75 and 40 instead of 75 and 85), then the demand is said to be more… (ID-MI1-32)
A. …elastic.
B. …inelastic.
C. …distorted.
D. …artificial.
33. Positive statements as opposed to normative statements attempt to describe the world as it is. (ID-MI1-33)
A. True
False
34. Challenging a current market system with a new idea which may be better for the future can be considered as a… (ID-MI1-34)
A. …market projection.
B. …positive statement.
C. …negative statement.
D. …economic projection.
E ..normative statement.
35. How do you calculate the consumer surplus on a Supply-Demand graph? (ID-MI1-35)
A. It is the area under the Demand curve and above the market price.
B. It is the area above the Demand curve and under the market price.
C. It is the area above the Supply curve and under the market price.
D. It is the area under the Supply curve and above the market price.
36. Based on the following table, what is the opportunity cost of producing a unit of Jam for Canada? (ID-MI1-36)
| … | Hours needed for 1 unit | Amount procuded in 24 hours | ||
| Cheese | Jam | Cheese | Jam | |
| Canada | 6 | 2 | 4 | 12 |
| USA | 3 | 4 | 8 | 6 |
A. 4/3 Cheese
B. 1/3 Cheese
C. 6 Cheese
D. 1 Cheese
E. 3 Cheese
37. Based on the following table, what is the opportunity cost of producing a unit of Jam for USA? (ID-MI1-37)
| … | Hours needed for 1 unit | Amount procuded in 24 hours | ||
| Cheese | Jam | Cheese | Jam | |
| Canada | 6 | 2 | 4 | 12 |
| USA | 3 | 4 | 8 | 6 |
A. 4 Cheese
B. 3/4 Cheese
C. 1/3 Cheese
D. 1/3 Cheese
E. 4/3 Cheese
38. Based on the following table, Canada has the absolute advantage in… (ID-MI1-38)
| … | Hours needed for 1 unit | Amount procuded in 24 hours | ||
| Cheese | Jam | Cheese | Jam | |
| Canada | 6 | 2 | 4 | 12 |
| USA | 3 | 4 | 8 | 6 |
A. …Jam and USA has an absolute advantage in Cheese.
B. ….(cannot be answered due to lack of information).
C. …Cheese and USA has an absolute advantage in Jam.
D. …neither good and USA has an absolute advantage in Jam.
E. …neither good and USA has an absolute advantage in Cheese.
39. The price elasticity of supply is concerned with… (ID-MI1-39)
A. …change in price due to change in quantity demanded.
B. …change in supply due to change in market prices.
C. …change in price due to change in market demand.
D …change in supply due to change in market competition.
E. …change in supply due to producer’s ability to fulfill the market demand.
40. An effective ceiling price will result in… (ID-MI1-40)
A. …abundance of good and decrease in demand.
B. …will help the customers.
C. …shortage of goods and increase in demand.
D. …shortage of good decrease in demand.
41. If the number of hours you studied for Economics 201 increases your confusion of concepts, you can say that studying have a… (ID-MI1-41)A. …no correlation.B ..random correlation.
C. …negative correlation.
D. …positive correlation.
E ..neutral correlation.
42. Based on the following table, Canada has a comparative advantage in… (ID-MI1-42)
| … | Hours needed for 1 unit | Amount procuded in 24 hours | ||
| Cheese | Jam | Cheese | Jam | |
| Canada | 6 | 2 | 4 | 12 |
| USA | 3 | 4 | 8 | 6 |
A. …Cheese and USA has a comparative advantage in Jam.
B. …neither and USA has a comparative advantage in Cheese.
C. …neither and USA has a comparative advantage in Jam.
D. …Jam and USA has a comparative advantage in Cheese.
43. Price control will most likely result in… (ID-MI1-43)
A. …creating a fair and balanced economies.
B. …creating more competition hence reducing monopolies.
C. …helping the producers by generating more revenuer.
D. …hurting the consumers that needed the most help.
44. The concept of “invisible hand” best applies to what kind of economies? (ID-MI1-44)
A. Command economies.
B. Free economies.
C. Market economies.
D. Mixed economies.
E. Traditional economies.
45. Which of the following scenario will increase both the equilibrium price and quantity of an inferior good? (ID-MI1-45)
A. Decrease in consumer income.
B. Increase in the number of substitution products.
C. Decrease in consumer demand.
D. Decrease in the number of substitution products.
D. Increase in consumer income.
46. What would be the most likely result of rent control? (ID-MI1-46)
A. Lower rent with higher quality housing.
B. Higher rent with lower quality housing.
C. Higher rent with higher quality housing.
D. Lower rent with lower quality housing.
47. If the City of Calgary has a problem with overuse of public swimming pools, the best solution to protect infrastructure is to… (ID-MI1-47)
A. …increase the usage fees.
B. …reduce the quality of pools and facilities.
C. …decrease the management costs.
D. …increase the maintenance budget.
48. Which of the following four graph (A, B, C, D) represents the market for Winter Coats in the middle of Canadian Summer? (ID-MI1-48)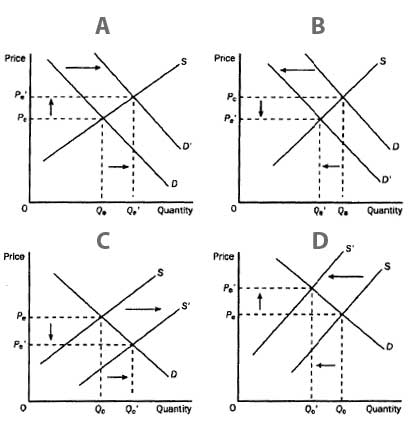
A. Graph D
B. Graph C
C. Graph B
D. Graph A
49. The self-interest of the participants in an economy is guided into promoting economic self-interest by (ID-MI1-49)
A. government intervention.
B. private sector regulations.
C. market power.
D. individual property rights.
E. the invisible hand.
50. What is market failure? (ID-MI1-50)
A. It is a situation in which market on its own fails to allocate resources efficiently.
B. It is a situation in which a firm exits a market due to financial failure.
C. It is a situation in which wrong products and services in the wrong market results in low demand and eventual failure.
D. It is a situation in which a product or a service failed to generate enough demand to be successful.
Credits: Based on the excellent class notes provided by, Dr. Ronald Schlenker during Summer 2014.