The stereographic projection is a methodology used in structural geology and engineering to analyze orientation of lines and planes with respect to each other. The stereonets is a type of standardized mapping system that allows us to represent various angles in 3D space on a 1D paper. They are used for analysis of various field data such as bedding attitudes, planes, hinge lines and numerous other structures. This is a very useful tool because it can reduce the workload by avoiding lengthy calculations.
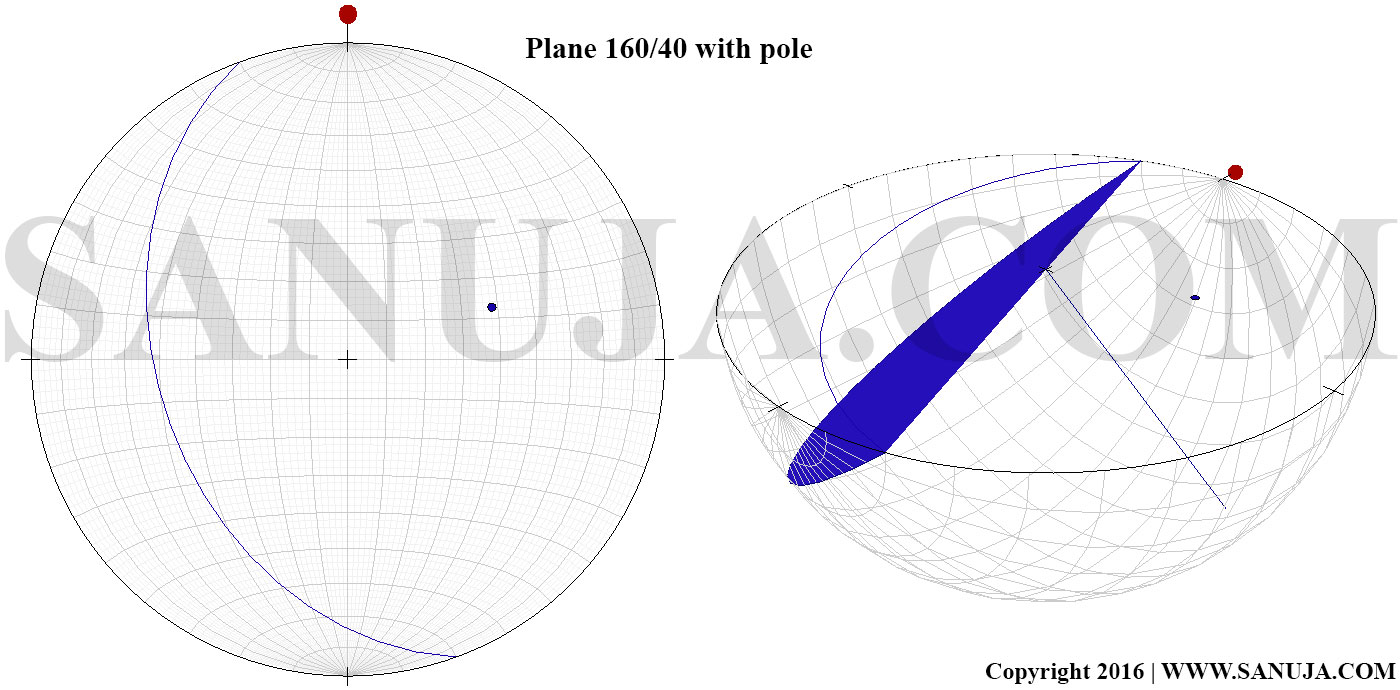
In structural geology, we use the bottom half or hemisphere of the spherical projection. If you are a mineralogist, you will use the top half of the spherical projection for crystallographic analysis. The reasoning behind which hemisphere we used is more conceptual than anything. This will be explained in depth in a different article. What is important to someone who just started using steronets is to recognize that steronets represents half a sphere where the cross section has 360-degrees. The pole to the plane (“dip pole”) is at 90-degrees to the plane. Planes are lines are drawn on steronets as they intersect at the bottom of the sphere (Figure 1).
Types of Steronets
There are two widely used types (and may be more) of stereonets by structural geologists. They are equal area stereonet and equal angle stereonets. The choice either should not affect the data analysis. The analysis and interpretation of data achieved through the use of either equal area of equal angle steronets should result in same conclusions.
However, the equal area steronets will reduce the area distortion. In other words, it is often used to analyze accuracy of data from several different regions of the same area. It is also useful in structure stereonet contouring. Hence, most educational institutions prefer equal area steronets for their students over the equal angle stereonets.
The equal angle stereonets are suitable for kinematic analysis. In other words, they provide the best projection for analyzing the direction and the vectors of structural forces. This is because the equal angle stereonets preserves the true relationships between stratigraphic and structural features.
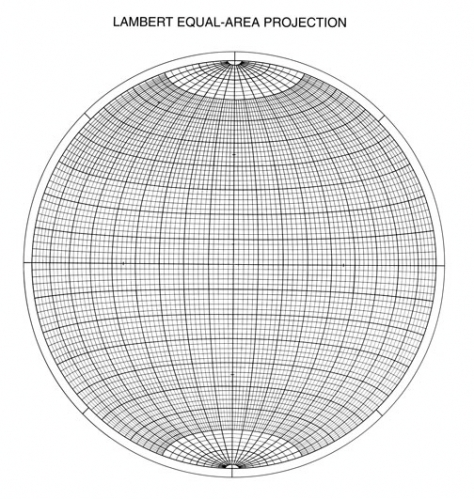
For our discussion here, I will be using Wulff-Lambert type, which will preserve the angles.
Nomenclature
North:It is the true North which is denoted by the azimuthal angle of 000-degrees on the primitive. All strike angles are measured with respect to the true North.
Primitive: It is the outer most circle is the primitive. It is at 90-degrees from the center of the stereonet. Primitive circle is also a great circle but, it contains N, E, S and W directions at 000, 090, 180 and 270 degrees intervals.
Great circle: A circle on the surface of the sphere made by the intersection with the spehere of a plane that passes through the center of the sphere. The great circles run North-South (longitudinal) or up-down and bisect the sphere precisely. The great circle is divided in to 360 degrees (like 360 degree protractor) because maps are designed based on same azimuthal (bearing) directional vectors. If you have understand how 3D vectors work, this should be a no-brainer.
Small circle: A circle on the surface of a sphere made by the intersections of a plane that does not pass through the center of the sphere. Small circles run left-right (latitudinal) on the stereonets and are perpendicular to the great circles.

Types of Geological Plotting and Data Usage
– Bedding surface, fault or a structure (“features”): strike of any of these will plot as a line on the stereonet.
- strike measured using the great circle
- always rotate the tick mark for the strike to the North, then counts from East (right hand side) towards the center for dip (or use the right hand rule)
- use same principles for overturned beds (you cannot differentiate an overturned bed from a regular bed on a steronet)
– Pole to a feature: is always exactly 90-degrees opposite to the dip direction of the feature.
- should me marked as a dot with a circle around it
– Trend: tread is always taken on line to a plane (NOT on the line)
- usually deal with folds axis or a fault (ONLY on intersection of the line)
- move the intersection to the North (or to a straight line) and make a tick/line on the great circle where the intersection meets
- move back the trace paper to align with North; the point at which the tick intersect the great circle is the trend
– Plunge: it provides the angular information on how deep a structure is dipping in to a surface; very common feature in coal beds and folds
- plunge is the distance between the great circle and the intersection
– Rake (pitch): distance between the intersection and the great circle along a plane/line (must be less than 90) rake is the angle between strike and trend
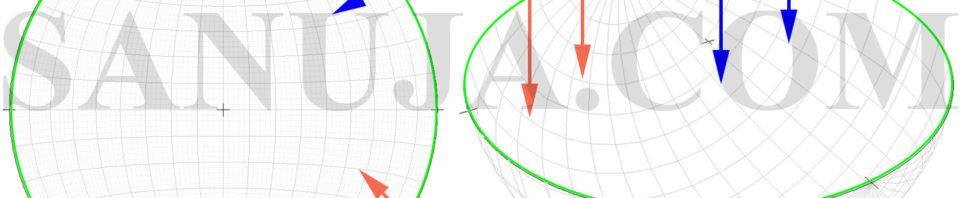
On the animation above, I drew two vectors out of several which can be used to interpret a normal fault. The red arrow is the displacement vector which is obtained by the horizontal and vertical displacement. The horizontal displacement is indicated with the brown arrow (vertical displacement is NOT shown). The rake of the fault is between the left most edge of the footwall and the displacement vector(red). The green arrow represents the rate of drop with respect to the original block. We use slickensides to interpret the sense of motion in the field.
Example with Data

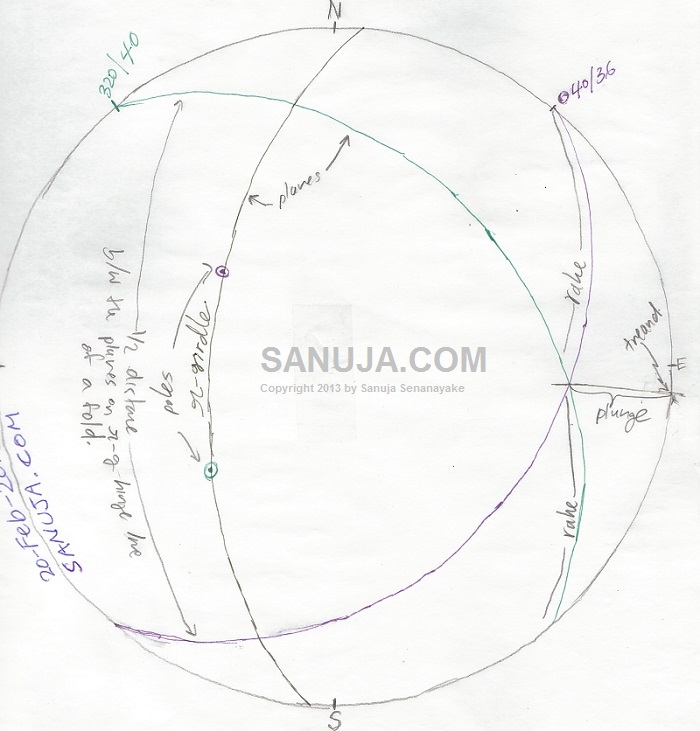
Based on the above diagram…
-There are two planes; A and B
-There are two rake angles measured on the planes itself; measured between the intersection point 3 and the great circle. For example, from intersection point 3 upwards towards NW direction of the great circle intersection of plane A. Plane B rake is downwards towards SE direction.
-The pi-gridle is determined by plotting poles to the Plain A and B at 90 degrees, then alining them on one of the lines on the stereonet. The point 1 and 2 are best fit line points for the poles that lies about the center of the diagram.
-Trend is the along the point 1 and 3, directly outwards on to the great circle (it is NOT marked in this diagram). It is measured on the great circle itself.
-Plunge is the distance between the great circle-trend intersection and the point 3.
A detailed diagram…
Manual versus Software
There are absolutely no differences between the interpretations made using manual drawing and software-based drawing of datasets. In work environment, we usually use software to generate stereonets. The software often eliminates many user errors, produce much better quality steronets extremely detailed analysis of datasets and make it easier to share with other over electronic devices. For someone who is starting in geology or structural geology, it is highly recommended to use paper and pencil over software. This will help you learn the fundamentals of stereographic projection. Typically university geology and engineering students are expected create stereonets by hand.
Updated: 23-April-2016