Practice Questions – Topics 2 to 15
Credits: Based on the excellent class notes provided by, Dr. Kristopher Innanen during Winter 2014.
FAQ | Report an Error
Topic 8 – The convolution model
1. Convolve the following sequences at and bt using the method of reverse and shift.
(a) at = {2, 3, 2} and bt = {3, 1}.
(b) at = {1, 3, 2, 1} and bt = {1, 2, 1}.
(c) at = {2, 1, 1, 0} and bt = {2, 3, 1}.
(d) at = {0, 3, 0, 0, −1, 0, 0} and bt = {2, 1}.
2. Repeat (a)–(c) in Question 1 using the method of polynomial multiplication.
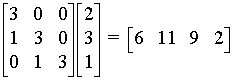
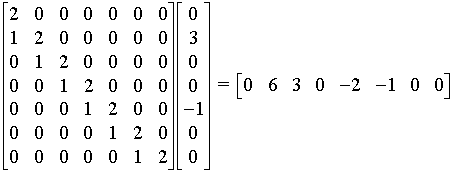
3. Using the elements of bt in Question 1a, express the “convoluion matrix” (or “dispersion matrix”) needed to get the right answer using the method of matrix multiplication. Check that it works.
4. The figure is a geological model made up of 3 interfaces separating four layers. Your goal is to construct the reflectivity series associated with this model. You have picked a time sequence 512 pts in length, with a time interval of 0.002s (2 milliseconds): t = {0.000, 0.002, 0.004, …, 1.022}. To get started, you write out a reflectivity series of the same length, full of zeros:
rt = {0, 0, 0, …, 0}.
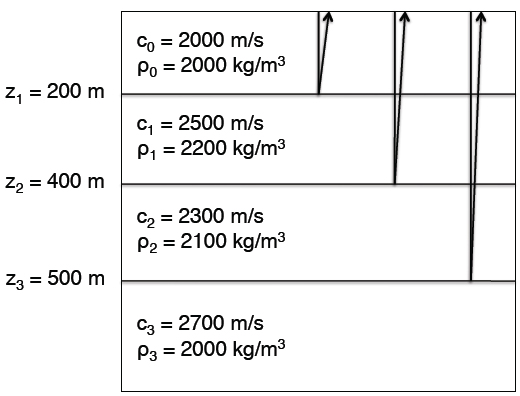
(a) Calculate the travel times τ1, τ2, and τ3 of the three events to be included in the reflectivity.
(b) The first (leftmost) element of rt is assigned the index 1, and the last (rightmost) el- ement rt is assigned the index 512. Find the indices best suited to be given “spikes” (i.e., changed from a 0 to a 1), using τ1, τ2, and τ3.
(c) Take your three spikes and change their amplitudes (currently 1) to their correct values using the information in Figure 1.
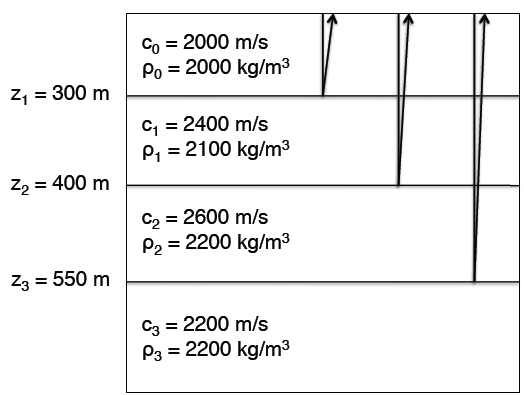
5. Repeat Question 4 using the layered geological model given in the following figure.
Topic 9 – Seismic spectra and filtering
1. In the top panel of Figure 1 is a simple time signal d(t). It is specifically chosen because it can be synthesized through a combination of the two Fourier basis vectors x1(t) and x2(t) plotted in the middle and bottom panels respectively.
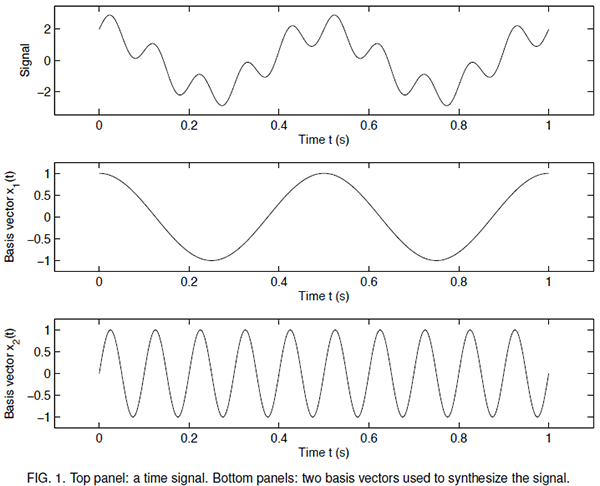
(a) What are the frequencies of the two basis vectors x1(t) and x2(t) in Hz? (b) What are the frequencies of the two basis vectors in radians per second? (c) Write d(t) as a weighted sum of the two basis vectors.
(d) What are the weights need for each basis vector in order to synthesize d(t)? Hint: to see how much of any particular basis vector is in the signal, look for places along the time axis where the other basis vector happens to go to zero.
2. Repeat the above question with the signal and basis vectors in Figure 2.
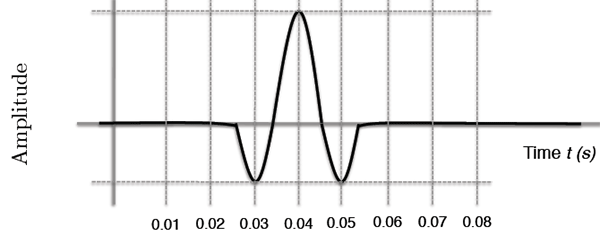
3. In the top panel of Figure 3 is a simple time signal.
(a) What is the dominant frequency of this signal in Hz? (b) What is the angular frequency of this signal?
(c) In the bottom panel is an empty space for plotting a curve vs. frequency f . Sketch the amplitude spectrum of the time signal here.
4. Repeat (a–c) in the above question using the time signal in Figure 4.
5. In the top panels of Figure 5 are four traces, each containing a single event. Below each of these is a plot of the associated amplitude spectrum.
(a) Estimate the dominant frequency of each trace.
(b) In words, what do you notice about the “width” of the event and its relationship to dominant frequency?
6. Repeat part (a) in the above question using the examples in Figure 6.
Topic 10 – Seismic Migration
1. If the velocity above a single horizontal interface is c0 = 2000m/s, and there is a reflected event in the zero offset section at time t = 0.3s, where in pseudo-depth will the reflector be placed using the “scaling the time axis” approach to image forming?
2. A horizontal interface lies 300m below a source and receiver pair. The velocity above the interface is 2500m/s.
- (a) What will be the arrival time of the reflection from this interface in the zero offset data set?
(b) At what pseudo-depth will the reflector be placed if the wrong velocity c0 = 2000m/s is used?
(c) At what pseudo-depth will the reflector be placed if the wrong velocity c0 = 3000m/s is used?
3. A dipping interface lies below a zero offset seismic survey. Below the midpoint location xm = 100m, the interface is at depth z2 = 200m. Below the midpoint location xm = 300m, the interface is at depth z3 = 250m. The seismic velocity above the interface is c0.
- (a) What is the dip angle γ in degrees?
(b) What is the depth z1 of the interface below the midpoint origin xm = 0?
(c) The travel time τ (xm) of the reflection from this interface as a function of xm is linear: τ (xm) = C xm + D. Draw a ray diagram describing the travel time. Derive mathemat- ical expressions for C and D in terms of z1 and γ.
(d) Prove that the pseudo-depth image zP (xm) of the dipping interface has a dip angle that is too small by a factor cos γ.
(e) Prove that if the velocity used to form the pseudo-depth image is c1 instead of the correct velocity c0, the dip angle is wrong by a factor (c1/c0) cos γ instead.
4. Draw an empty rectangular box. Let xm the horizontal axis, and travel time t the vertical axis. Sketch the travel time of the reflected event coming from a syncline reflector.
5. Describe in words the steps involved in carrying out migration by broadcast.
6. Let g(t) be a Gaussian function of the form:
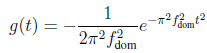
Show that the Ricker wavelet whose mathematical form we discussed in class is the second derivative of g(t) with respect to t.
7. A trace with a single event is illustrated in the following figure. What is its approximate dominant frequency?
8. What are the Ricker and Widess criteria for the resolution of nearby interfaces? Which criterion permits the interfaces to be closer and yet still be resolved? Why?
9. Two interfaces, embedded in rock with VP = 2000m/s, are separated by 30m. The source wavelet in a seismic experiment being carried out above has a dominant frequency of ωdom = 63 rad/s.
- (a) According to the Ricker criterion, should we expect to be able to resolve these two interfaces? Why?
(b) According to the Widess criterion, should we expect to be able to resolve these two interfaces? Why?
Topic 11 – Seismic amplitudes, well logs, and rock properties
1. Write down the symbols and units for the following rock properties of importance in reservoir geophysics.
- Porosity: the fraction of a given volume of rock taken up by pore space, i.e., void. This pore space can be filled with fluid: brine or hydrocarbon. From an economic point of view, brine is bad, and hydrocarbon is good.
- Density: the amount of mass per unit volume can be a strong indicator of porosity.
- Saturation (and Irreducible Saturation): the fraction of total pore volume taken up by brine. Brine is displaced by hydrocarbons, and so the presence of hydrocarbons is associated with a drop in S, down to an “irreducible” minimum saturation value, Si
- Permeability: a measure of the ability of fluid to flow through a geological medium with a connected set of pores. We consider the following experiment. We apply a pressure, p to fluid in a porous medium, and observe its flow through a distance, x. If the fluid itself is viscous, like ketchup or honey, this appears through its viscosity (units of pressure X time). We observe the flow rate of the fluid, that is, the volume flowing past the exit point per second, or v.
2. Explain in words the difference between a tight and a fair reservoir. What parameter and what range of values in this parameter identify a reservoir as tight or fair?
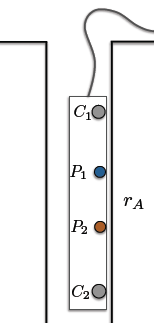
3. Sketch a vertical well containing a sonde configured for an electrical resistivity survey. Label the four electrical components required.
4. Answer the questions using the following figure of a cylinder, through which a current I flows is illustrated.
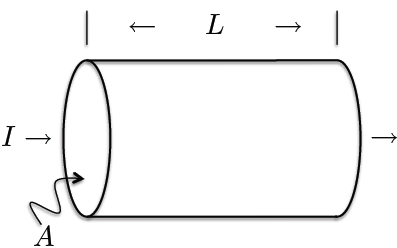
- (a) If a voltage drop of V is measured across this section of cylinder, what must its resis- tance R be? What are its units?
(b) Using the length L of the section and the area A of its circular face, relate the resistance R to the resistivity r.
(c) Explain in words why we might be interested in r more than R when characterizing rocks.
5. An electrical arrangement suitable for determination of the resistivity between points 1 and 2 is illustrated in the following figure;
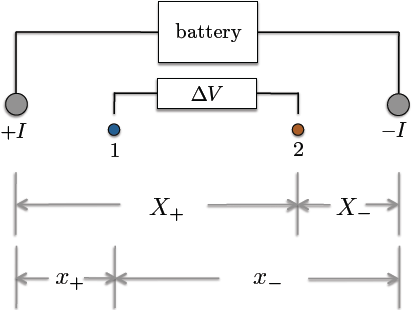
If we measure a potential as;

a distance x from a source/sink of current ±I , and the total V is the sum of potentials from any nearby sources or sinks,
- (a) Find an expression for the potential difference ∆V between 1 and 2.
(b) Use the result in (a) to find a formula for the resistivity between 1 and 2.
Topic 12 – A seismic data processing flow
1. List the standard items of the seismic processing flow in the order they are generally applied.
- Geometry: The location of the source/geophone pair associated with each trace is determined and stored.
- Muting, gaining, and filtering: Noise and certain seismic wave phenomena hinder data analysis. Some of these are relatively simple to suppress, and those that are we treat early in the process.
- Statics: The seismic data are corrected for surface topography and near-surface geology.
- Deconvolution: An approximate reversal of the convolution model, in an attempt to recover the reflectivity from the trace by removing the effect of the source wavelet.
- Sorting to CMP gathers: Traces, which are initially organized as they were acquired, in shot gathers, are re-organized into common midpoint gathers
- Velocity analysis: A velocity function is deduced from the velocity spectrum.
- NMO-stack: The velocity function is used to create the post-stack data set.
- Migration: The post-stack data set is then transformed into a subsurface image
2. What are three important steps you can take to do field quality control?
- Filtering: Time filtering is a computationally very rapid, trace-by-trace procedure, and very easy to carry out. Ground roll and other types of coherent noise tend to contribute at lower frequencies than reflections and events of interest. So, simple filters, such as the Ormsby filter discussed, can very rapidly bring out features of interest, such as reflections, that are often hidden in raw data.
- Dominant frequency estimation: Even without spectral analysis, a ruler and pencil will suffice to do quick dominant frequency calculations.
- Velocity calculations: Linear events can be used to derive velocities particular in the near surface. Velocities and dominant frequencies can be used to form rough estimates of dominant wavelengths, and thus resolution.
3. Explain what the input and desired output of deconvolution using the quantities you learned in Topic 8—the reflectivity series and wavelet.
Topic 13 – Theory of Gravity
1. Units in the gravity problem.
(a) What are the SI units of gravitational force? N/m
(b) What is 1 gu in terms of metres and seconds? 1 μm/s2
(c) What is 1 mgal in terms of gravitational units? 10-3 cm/s2
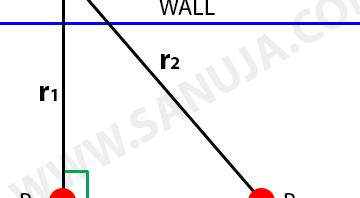
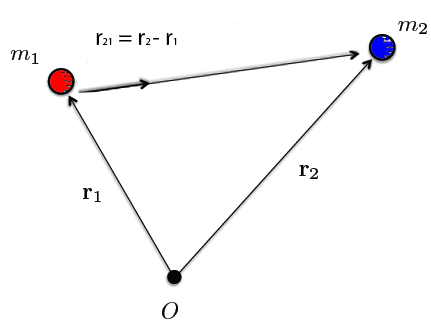
2. Sketch out a system of two particles m1 and m2, with their positions expressed with vectors r1 and r2 respectively, beginning at some origin O.
(a) Draw and label the separation vector pointing from m2 to m1. Write it in terms of r1 and r2.
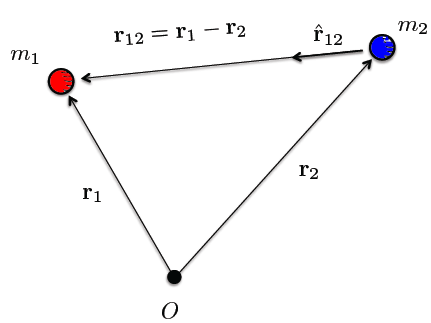
(b) Repeat (a.) for the separation vector pointing from m1 to m2.
(c) The law of Universal Gravitation tells us the two particles will exert forces on one another. Write down the mathematical form of the force felt by m1 due to m2, using the separation vector in (a.).
Check d
(d) Write down the mathematical form of the force felt by m1 due to m2, using the separation vector in (b.).
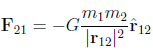
(e) Write down the mathematical form of the force felt by m2 due to m1, using the separation vector in (a.).
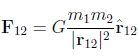
(f) Write down the mathematical form of the force felt by m2 due to m1, using the separation vector in (b.).
3. You drop two cannonballs, one of which is twice the mass of the other. You confirm Galileo’s observation that they fall at exactly the same rate throughout their fall. But, you now know that the gravitational force on the first cannonball is twice that on the second. Why doesn’t the more massive cannonball fall faster?
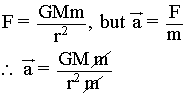
Since the smaller object mass, m cancels out and we only left with the mass of the Earth M, the acceleration due to gravity would be independent of the mass of the object.
4. You are equipped with a strange geophysical instrument, containing a cannonball of mass 25kg. The instrument tells you the magnitude of the gravitational force this cannonball feels due to any nearby masses. You walk along a thin wall (that itself has negligible mass), holding your instrument right against it. On the opposite side of the wall is another cannonball, hidden from view by the wall.
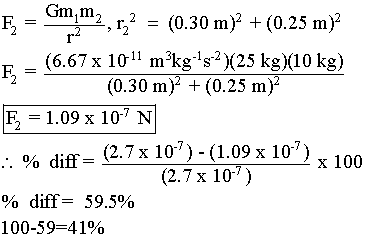
(a) You find yourself directly opposite, and 25cm away from, the hidden cannonball. Show with a full calculation that, if the hidden cannonball is of mass 10kg, the readout would be 2.7×10⁻⁷N.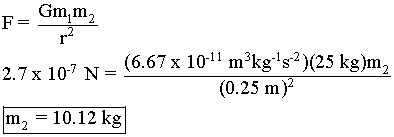
(b) If you now take a single step of length 30cm along the wall, show with a full calculation that the magnitude of the force is reduced by 41 percent.
We know the distance and the force reading at Point 1 and we know the parallel movement, which is 0.30 m. This is enough information to calculate the force at Point 2 as shown below.
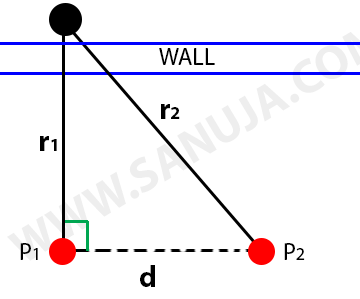
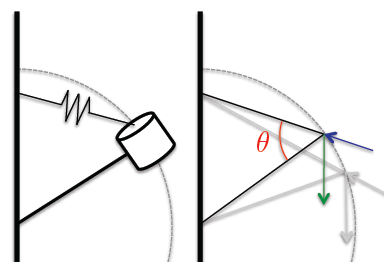
(c) Suppose the hidden cannonball is replaced with another. You don’t know its mass, and you don’t know where along the wall it has been put. But, you do know it is 45cm away from the wall. Explain in words how you could determine when you were directly opposite the hidden cannonball, by walking along the wall and monitoring the magnitude of the force.
Regardless of how far away from the wall the ball is placed, the position of the meter at which it will read the largest field value would be the closest point to the unknown mass. This can be proven using the principles of Geometry, Trigonometry and Calculus.
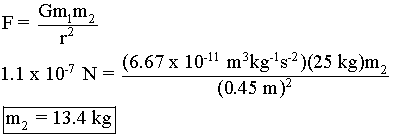
(d) You find this position. Your instrument tells you that the force at this point is 1.1×10⁻⁷N. Show with a full calculation that the mass of the cannonball must be 13.4kg.
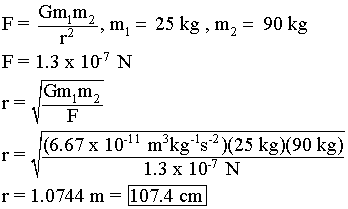
(e) Suppose the cannonball was replaced again, this time with one whose mass you knew to be 90 kg. But, this time you don’t know how far from the wall it is. You again find the point directly opposite it along the thin wall, and measure the force to be 1.3×10⁻⁷N N. Show with a full calculation that the cannonball must be 107cm from the wall.
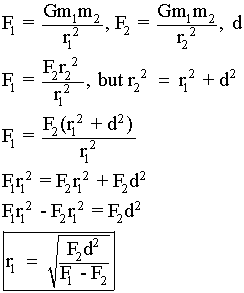
(f) Suppose you knew neither the mass of the cannonball, nor its distance from the wall. Discuss the problem of determining either of these values using your force measurement.
We can measure the maximum reading from the gravitometer by waling in a straight line parallel to the wall (F1). By principle of gravity and geometry, the maximum must be at exactly 90-degrees (directly opposite/perpendicular) to the straight path. Therefore, we can now walk parallel on the same line to a new point (Point 2 on the diagram) and take another reading F2. Knowing the distance you traveled, d and the two measurements, you can do the following calculations.
(g) If the hidden cannonball were replaced with a bowling ball that had the same mass, but a different radius (and therefore density), discuss in words the changes you would expect to observe in these force data you have been measuring.
Since the mass remains the same, the net force felt on each other would remain the same. Since we measure the distance from the measuring device to the center of sphere, the r value does not change either.
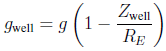
5. Suppose the Earth to be a perfect homogeneous sphere of mass M and radius RE . You dig a vertical well to a depth of Zwell. Show that the magnitude of the gravitational acceleration at the bottom of the well, gwell is reduced from that at the surface, g, by an amount
6. Using the law of Universal Gravitation, and Newton’s 2nd law, derive forms for
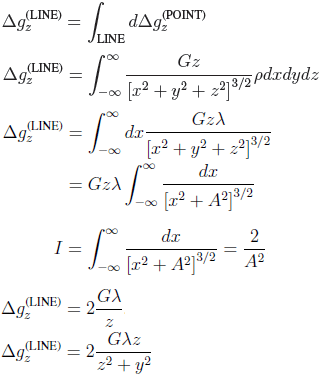
(a) The gravitational acceleration ∆g(POINT) felt at (0, 0, 0) due to a point mass at (x, y, z);
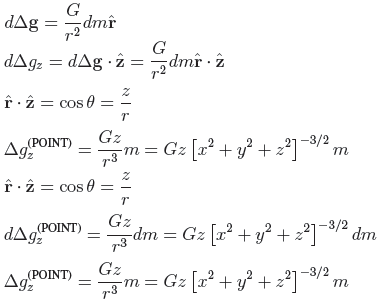
(b) The gravitational acceleration ∆g(LINE) felt at (0, 0, 0) due to an infinite line, of linear density λ, at depth z and offset location y.
7. A mass m1 is at position r1 = (x1, y1, z1), and a mass m2 is at position r2 = (x2, y2, z2).
(a) Gravity is a conservative force. What, therefore, is the relationship between the force
F12 felt by mass m2 due to mass m1 and their gravitational potential energy U ?
(b) Prove that, given (a.),
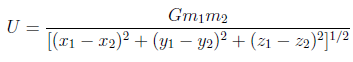
must be the correct form for the gravitational potential energy.
Topic 14 – The gravity experiment
1. What is the relationship between ∆gz and the spring extension ∆x in a vertical gravimeter? Explain how this relationship arises, starting from the fact that the vertical spring experiences a restoring force ∆F = −k∆x when extending by ∆x.
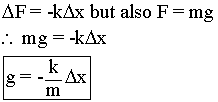
Therefore we can conclude that the change in gravity is directly proportional to the change in the length of the spring.
2. How could a spring be “zero-length”?
Change in length of springs are directly related to the force in which the spring is subjected to, creating a linear relationship. A conventional spring would have a normal length, when it is not being subjected to outside forces (no stretching). A “zero-length” spring is a special type of spring in which the spring itself is per-tensioned. This pre-tension will cause the spring to be at notional zero when it is not under any outside force.
3. Explain the importance of “mechanical amplification” to gravimeter design.
4. Extra: explain the basic logic of a photomultiplier (using, e.g., wikipedia). Describe the fundamental similarity or difference between this idea and that of a mechanical amplifier.
5. Extra: explain the basic logic of a centrifugal governor (using, e.g., wikipedia). Describe the fundamental similarity or difference between this idea and that of a mechanical amplifier.
Topic 15 – Gravity methods
1. List the steps involved in reducing gravity measurements.
The variation in data may or may not be caused by geological anomalies. We use the data reduction techniques to isolate the anomalies of true geological origins.
- Drift Correction:
- Latitude Correction:
- Elevation Correction:
- Free-air (FC):
- Bouguer:
2. Describe the procedure to correct gravity measurements for instrument drift. Include a sketch of the base station ∆gz readings and of the survey ∆gz readings.
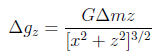
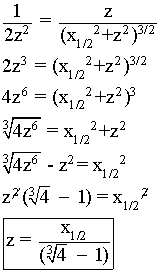
3. In 2D, the anomaly ∆gz measured at position (x, z = 0) due to a point or spherical excess of mass of ∆m located at position (x = 0, z), is;
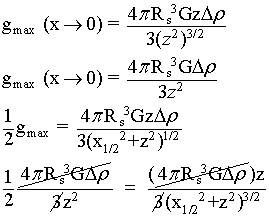
(a) Suppose that the excess of mass ∆m is the result of a spherical region (radius RS ) in which the density changes by ∆ρ. Re-write the equation above to reflect this.
(b) Prove that the width-at-half-max x1/2 of the response ∆gz (x) measured over a range of x values is related to the depth of the centre of the sphere by
![]()
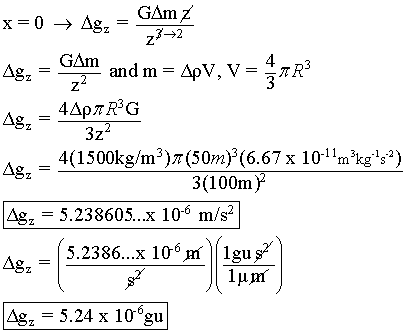
4. In a spherical region (radius 50m) at position x = 0m and z = 100m, the density changes from a background value of 2000 kg/m3 to an anomalous value of 3500 kg/m3. Sketch the resulting Bouguer anomaly, giving the curve the correct width in metres, and the correct height in g.u.
5. Use your answer from question 1(a) above to explain and exemplify the problem of non- uniqueness in geophysical data. Give two different distributions of Earth properties which produce the same data.
A slab can produce the same data because a point on a slab also behave sphere. Also, the delta g is a product of the density and the thickness (d), different combinations of these two variables can produce the same delta g. Therefore, this set of data will be non-unique.
6. A client has asked you as a geophysics consultant to carry out a gravity survey along a 1 kilometre profile, seeking small, point-like anomalies that are expected to be at depths of 10-12m. You have been asked to keep the total costs to under $10,000. You charge $100 per survey point. What do you tell the client? Can this be done? Explain your reasoning.